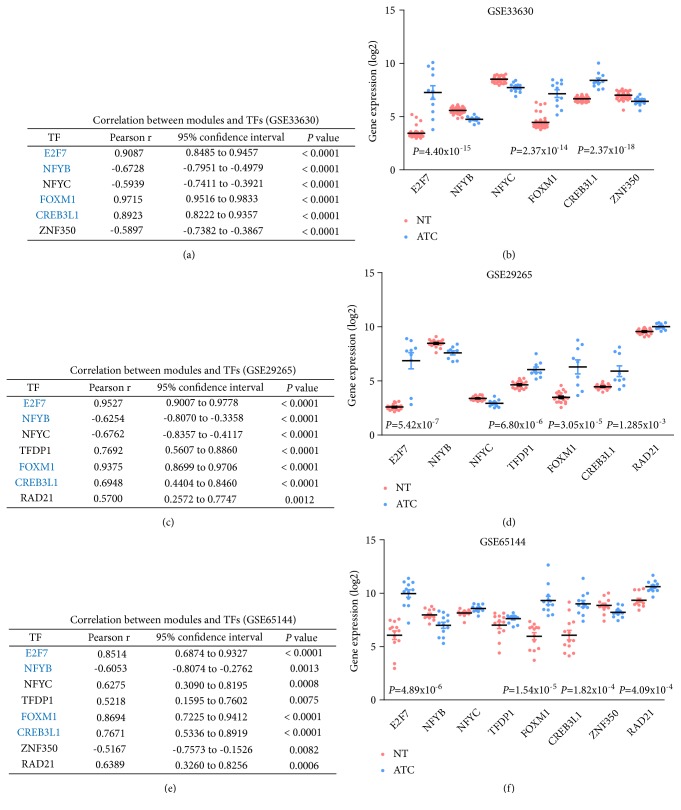
Figure 6.
Correlation analysis of master regulators and modules. (a, c, e) Pearson correlation analysis of TFs and modules. Blue fonts indicated consistently correlated TFs in three microarray datasets. (b, d, f) The expression profiles of TFs with Pearson r >0.5 or < -0.5 were retrieved from GSE33630, GSE29265, and GSE65144. TFs, transcription factors.

