
Figure 4.
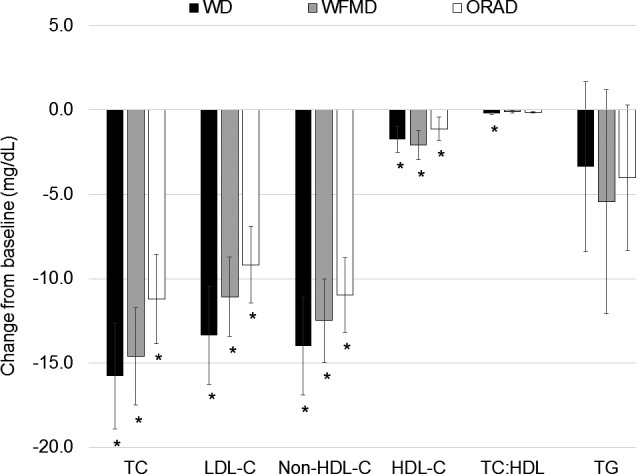
Mean changes from baseline for lipids and lipoproteins following each of the three 6‐week study diets (n=45). Change scores were calculated by subtracting the values following the run‐in diet from values following each study diet and were compared using the MIXED procedure (SAS v9.4; SAS Institute). There was a significant reduction in TC, LDL‐C, non–HDL‐C, and HDL‐C after all diets compared with baseline. *P<0.05 for the within‐diet change from baseline. LDL‐C indicates low‐density lipoprotein cholesterol; non–HDL‐C, non–high‐density lipoprotein cholesterol; TC, total cholesterol; TG, triglycerides.