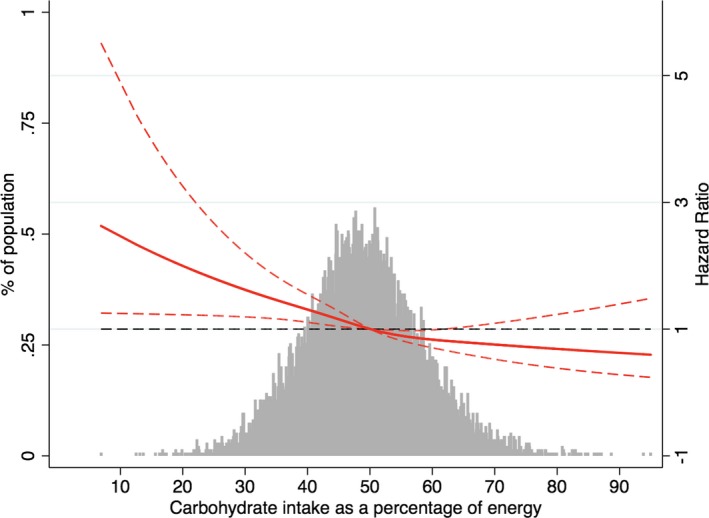
Figure 3.

Adjusted hazard ratios of atrial fibrillation by baseline carbohydrate intake as a percentage of energy. Each hazard ratio was computed with a carbohydrate intake level of 50% as the reference. The hazard ratio was adjusted for age, race, total energy intake, total fat intake as a percentage of energy, animal fat intake as a percentage of energy, total protein intake as a percentage of energy, animal protein intake as a percentage of energy, dietary fiber intake, glycemic index, glycemic load, body mass index, smoking, drinking, education level, sport, physical activity, total cholesterol, high‐density lipoprotein cholesterol, low‐density lipoprotein cholesterol, triglycerides, creatine, uric acid, hypertension, stroke, diabetes mellitus, coronary artery disease, and heart failure. Red solid line represents the hazard ratio of carbohydrate intake across the whole range. Red dotted lines represent the 95% CI. Black dotted lines is the reference line as hazard ratio =1. Histograms represent the frequency distribution of carbohydrate intake as a percentage of energy at baseline.
