Figure 2.

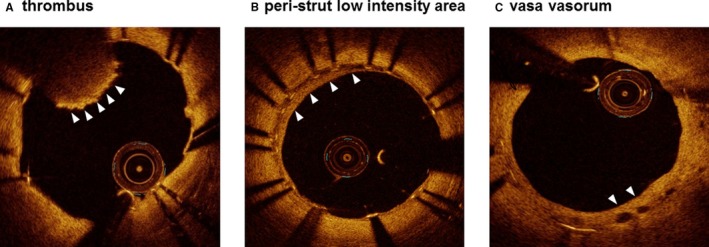
Representative optical coherence tomography images showing a thrombus (A), peri‐strut low‐intensity area (B), and vasa vasorum (C).

Representative optical coherence tomography images showing a thrombus (A), peri‐strut low‐intensity area (B), and vasa vasorum (C).