Figure 1.

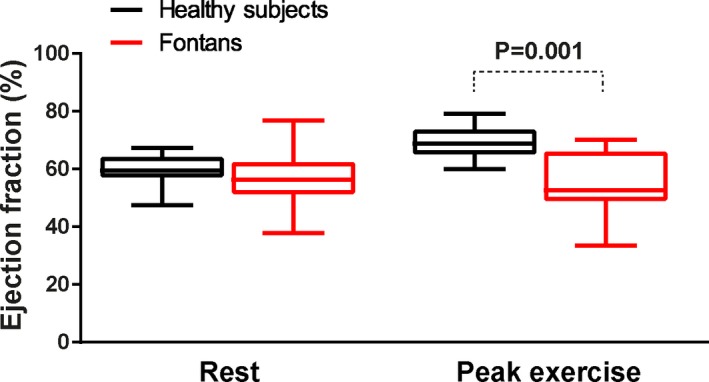
Distribution of systemic ventricular EF at rest and at peak exercise. At rest, EF was similar between groups, whereas at peak exercise EF was lower in the Fontan patients. EF indicates ejection fraction.

Distribution of systemic ventricular EF at rest and at peak exercise. At rest, EF was similar between groups, whereas at peak exercise EF was lower in the Fontan patients. EF indicates ejection fraction.