
Figure 4.
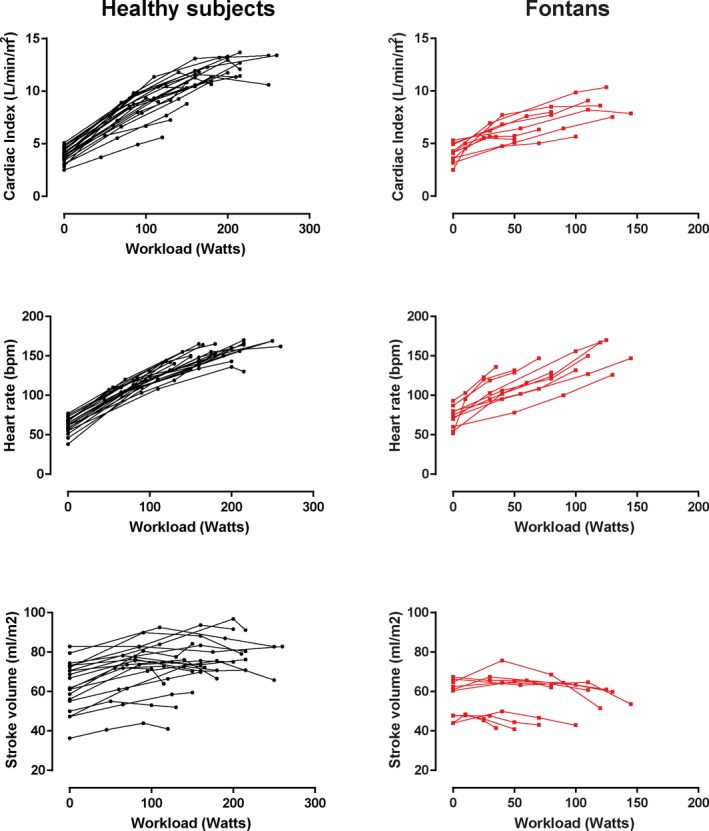
Individual changes in cardiac hemodynamics during exercise. Changes in cardiac index, heart rate, and stroke volume from rest to peak exercise are depicted in controls (left panels) and Fontan patients (right panels).
Official websites use .gov
A
.gov website belongs to an official
government organization in the United States.
Secure .gov websites use HTTPS
A lock (
) or https:// means you've safely
connected to the .gov website. Share sensitive
information only on official, secure websites.
Individual changes in cardiac hemodynamics during exercise. Changes in cardiac index, heart rate, and stroke volume from rest to peak exercise are depicted in controls (left panels) and Fontan patients (right panels).