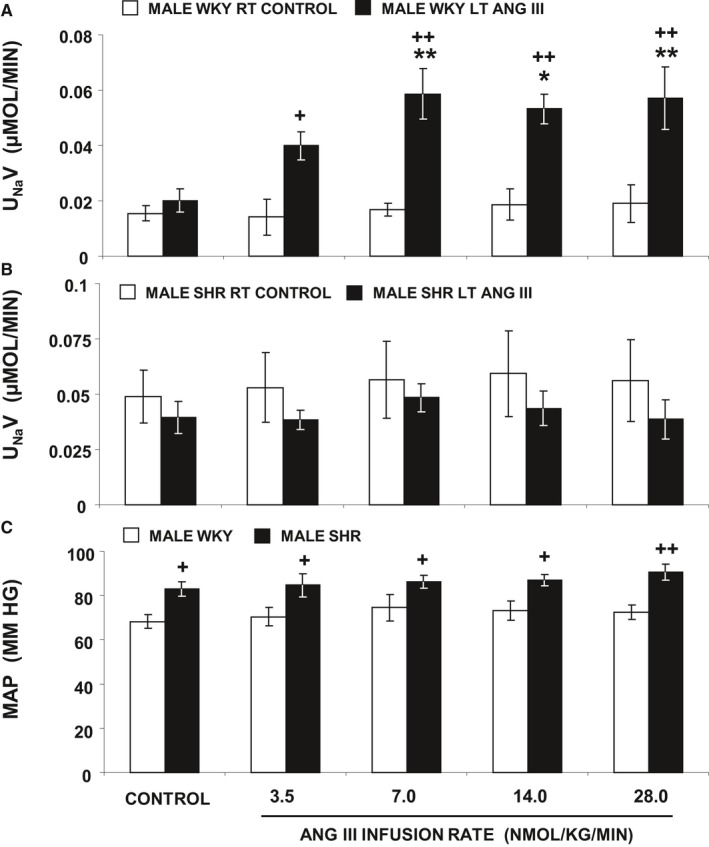
Figure 2.

A, Urine Na+ excretion (UN aV) under the following conditions: (white bar) male WKY right (RT) kidney renal interstitial (RI) control infusion (N=5), (black bar) male WKY left (LT) kidney RI Ang III (3.5, 7.0, 14.0, and 28.0 nmol/kg per min) infusion (N=5) all in the presence of systemic AT 1R blockade. B, Male SHR RT and LT kidneys (both N=6) that followed the same procedure as in A. C, Mean arterial pressure (MAP) under conditions described in (A and B). Data represent mean±1 SE. *P<0.05 and **P<0.01 from own control and + P<0.05 and ++ P<0.01 from corresponding period.
