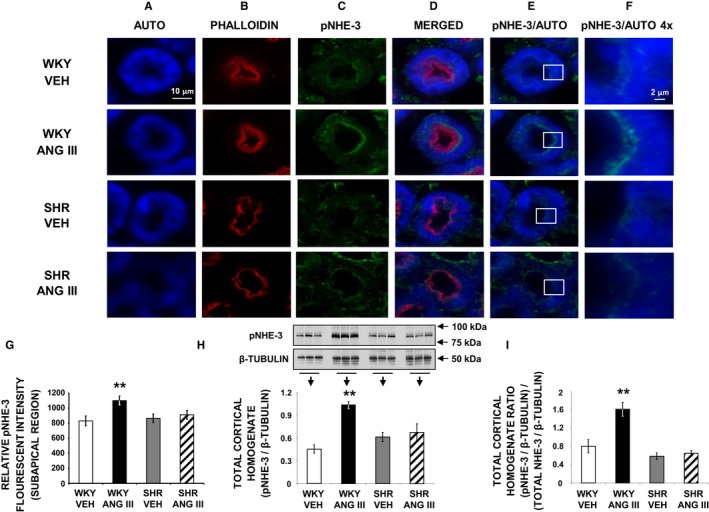
Figure 6.

Confocal micrographs (×600 magnification) showing pSer552‐NHE‐3 (pNHE‐3) localization in female Wistar‐Kyoto (WKY) and spontaneously hypertensive (SHR) renal proximal tubule cell (RPTC) thin sections (5–8 μm) after renal interstitial (RI) infusion of vehicle (VEH) or angiotensin III (Ang III; 7.0 nmol/kg per min). As indicated, rows of images show representative sets of RPTCs from (top‐to‐bottom) WKY VEH, WKY Ang III, SHR VEH, and SHR Ang III treatment groups. As indicated, columns (left‐to‐right) depict confocal autofluorescence (A), brush border membrane staining with phalloidin (B), pNHE‐3 staining (C), merged image (D), merged image of only confocal autofluorescence and pNHE‐3 (E), and enlarged images (×4) of the square sections in (E) (F). The scale bars in the first and sixth columns represent 10 and 2 μm, respectively. G, The quantification of RPTC subapical pNHE‐3 fluorescence intensity performed on 20 independent measurements of RPTCs from 1 rat for WKY VEH (white bar), WKY Ang III (black bar), SHR VEH (gray bar), and SHR Ang III (striped bar) treatments. H, Western blot analysis of total cortical homogenate pNHE‐3 protein in female WKY and SHR after VEH or Ang III (3.5–28.0 nmol/kg per min) infusions (N=6 for each condition). All blots were normalized to β‐tubulin. I, Ratio of (pNHE‐3/β‐tubulin)/(NHE‐3/β‐tubulin) for all 4 conditions. Data represent mean±1 SE. **P<0.01 compared with WKY VEH.
