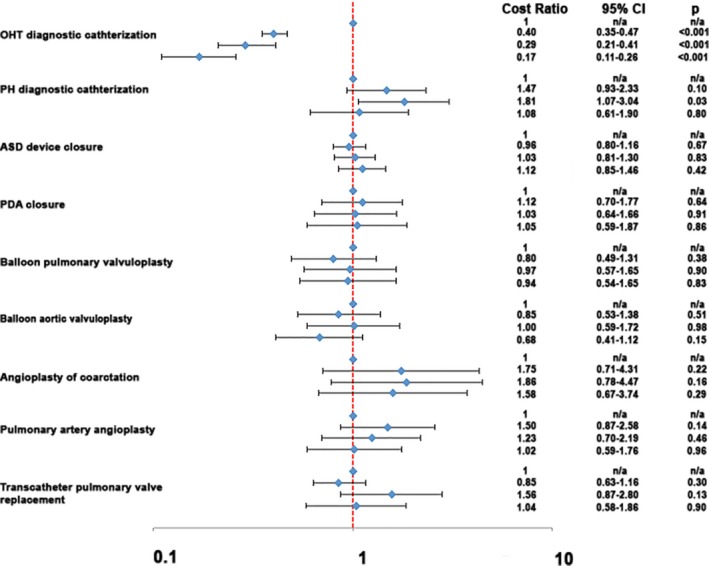
Figure 3.

Association of hospital catheterization laboratory volume and cost. Forest plot depicts the results of a series of multivariable generalized linear models evaluating the association between hospital procedural volume and cost. Hospital catheterization volume is divided into 4 categories: ≤150 cases/year, 150 to 300 cases, 300 to 500, >500 cases (listed top to bottom for each procedure). For each procedure, the ratio of cost associated with higher procedure volume (relative to centers (≤150 cases/year) is marked with a blue diamond. The 95% CIs are depicted as brackets. A ratio of 1 is marked with a hashed orange line. Estimates to the left of this line reflect reduced cost with increasing volume, whereas estimates to the right reflect an association between increasing volume and higher cost. Results for a sensitivity analysis with hospital cardiothoracic surgical volume were similar but are not shown. ASD indicates atrial septal defect; n/a, not assessed; OHT, orthotopic heart transplant; PDA, patent ductus arteriosus; PH, pulmonary hypertension.
