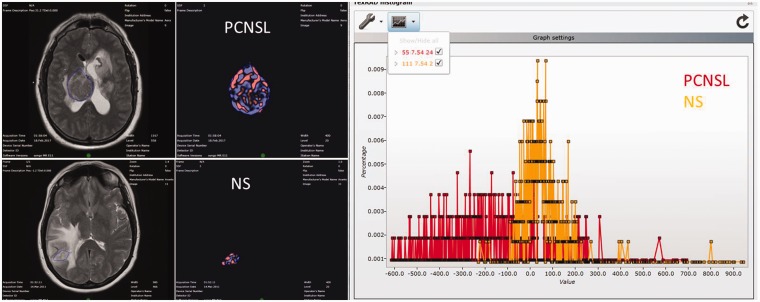
Figure 1.
Illustrative example of the magnetic resonance texture analysis (MRTA) methodology. The far-left column demonstrates the axial T2-weighted image (T2WI) with the region of interest (ROI) outlined, based on the post-contrast images. The middle column demonstrates the filtered texture images. The right-sided image shows the histogram distribution within the ROI.

