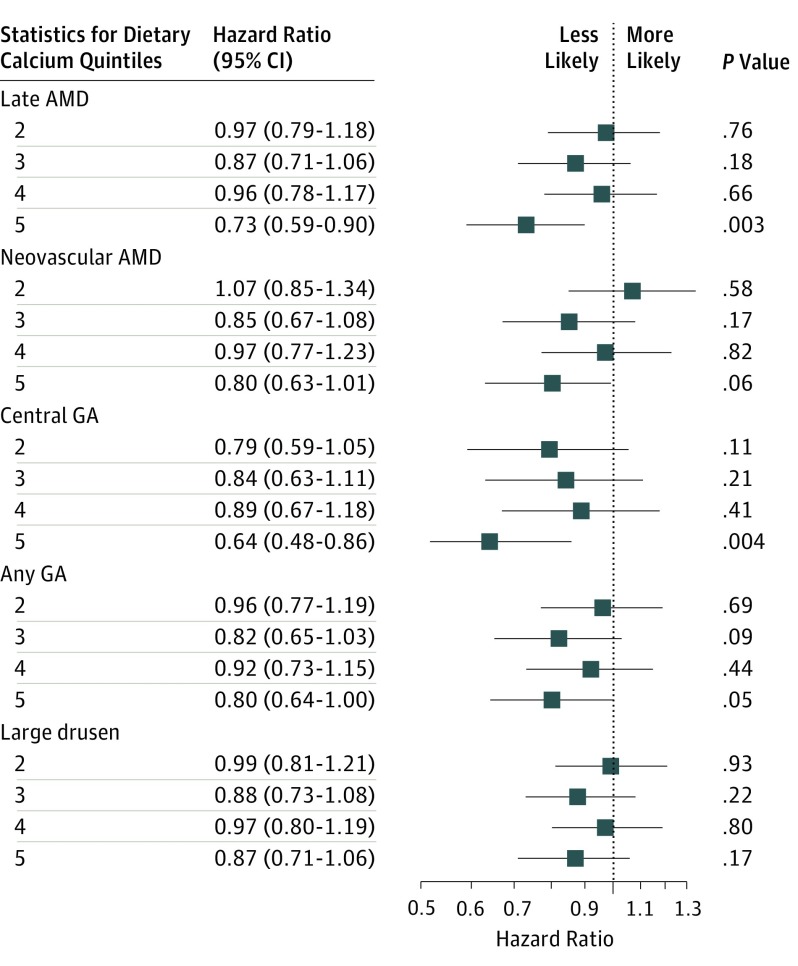
Figure 1. Comparison of Self-reported Dietary Calcium Intake (Highest vs Lowest Quintiles) for Incidence of Age-Related Macular Degeneration (AMD).
The reference group is composed of participants in quintile 1 of self-reported calcium intake levels; quintile 1 represents the lowest calcium intake, and quintile 5, the highest. GA indicates geographic atrophy.

