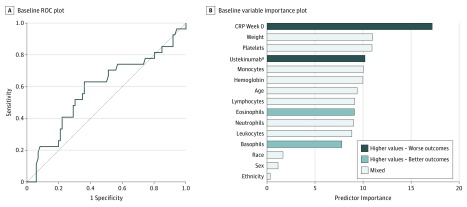
Figure 1. Baseline Predictors.
A, Receiver operating characteristic (ROC) plot for baseline model. The area under the ROC curve in the representative testing set was 0.59 (95% CI, 0.46-0.72). B, Baseline variable importance plot. The importance of each predictor was computed by identifying nodes in the trees and summing up all information provided by the nodes containing the predictor. The higher the importance, the larger the total discrimination provided by the predictor. CRP indicates C-reactive protein.
aLevel 1 hour after first dose.

