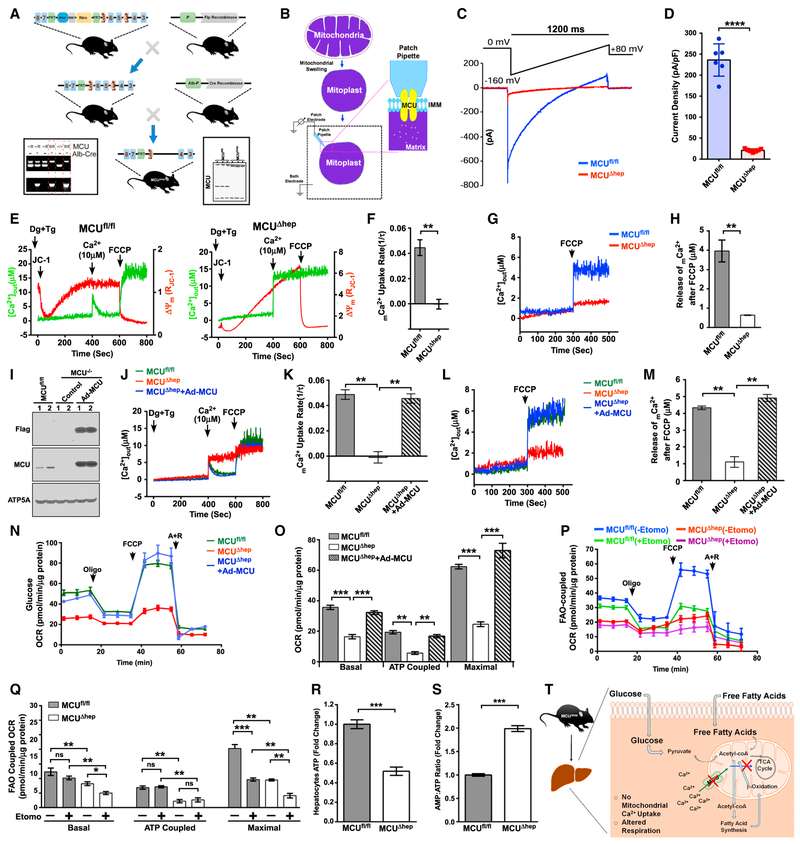
Figure 1. Hepatocyte MCU Activity Regulates FAO-Coupled Mitochondrial Respiration.
(A) Generation and confirmation of MCUΔhep mice by PCR genotyping (left) and western blotting (right).
(B) Schematic representation of the patch-clamp technique for measuring MCU channel activity.
(C) Representative IMCU traces derived from MCUfl/fl and MCUΔhep mitoplasts.
(D) IMCU densities (picoamperes/picofarads) in mitoplasts. n = 6.
(E) Representative traces of extramitochondrial Ca2+ ([Ca2+]out) clearance and DJm in permeabilized hepatocytes from MCUfl/fl and MCUΔhep. n = 3.
(F) mCa2+ uptake rate calculated from (E). n = 3.
(G) Representative traces of [Ca2+]out rise from MCUfl/fl and MCUΔhep. n = 3.
(H) Quantification of mCa2+ after addition of carbonyl cyanide 4-(trifluoromethoxy)phenylhydrazone (FCCP) from (G). n = 3.
(I) Immunoblot for the reconstitution of MCU in MCUΔhep mice using adenovirus-mediated delivery. n = 2.
(J) Reconstitution of MCU restores [Ca2+]out clearance ability. n = 4.
(K) mCa2+ uptake rate calculated from (J). n = 4.
(L) MCU reconstitution restores the matrix Ca2+ in MCUΔhep. Shown are representative traces of [Ca2+]out rise in response to FCCP. n = 4.
(M) Quantification of mCa2+ calculated after addition of FCCP from (L). n = 4.
(N) MCU reconstitution restores the OCR in MCU KO hepatocytes. n = 3.
(O) Quantification of basal, ATP-coupled, and maximal OCRs in hepatocytes from (N). n = 3.
(P) The FAO OCR was measured in MCUfl/fl and MCUΔhep hepatocytes using palmitate as a substrate with or without etomoxir (40 mM). n = 3.
(Q) Quantification of basal, ATP-coupled, and maximal FAO-coupled OCRs from (P). n = 3.
(R) Measurement of hepatocyte ATP. n = 3.
(S) Measurement of AMP:ATP ratio in hepatocytes. n = 3. Statistical analysis: mean ± SEM. *p < 0.05, **p < 0.01, ***p < 0.001; ns, non-significant.
(T) Schematic of hepatocyte deletion of MCU, showing reduction in mCa2+ and bioenergetic parameters.

