
Figure 3. Transfer of Microbiotas from Healthy Donors Increases Gut RORγt+ Treg Cells.
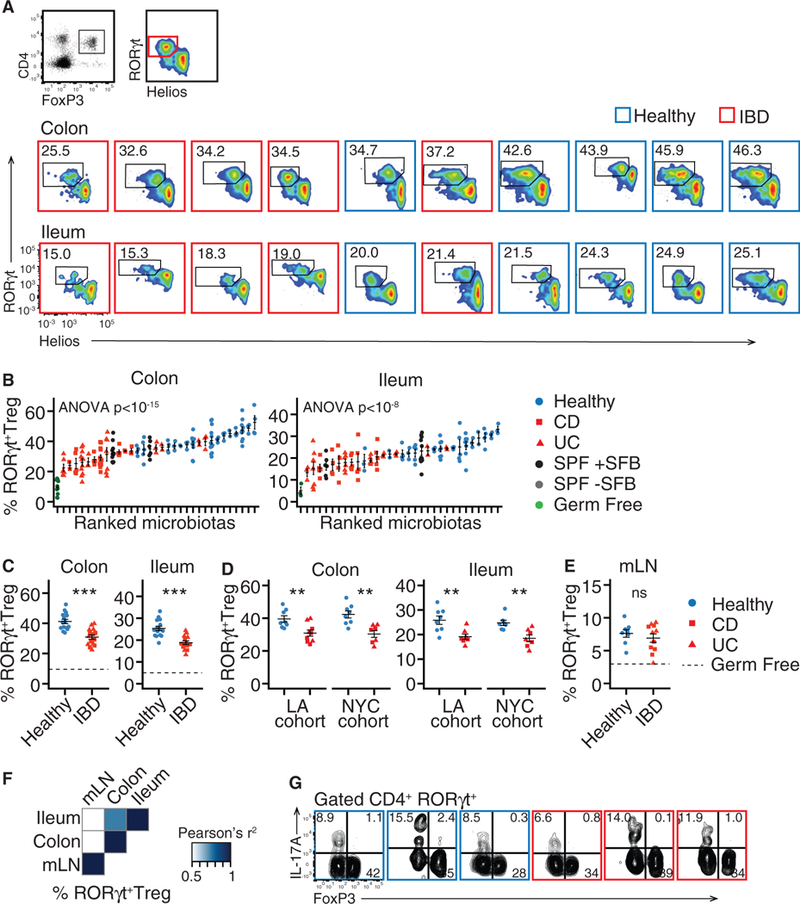
Germ-free B6 mice were colonized with fecal microbiotas from human donors with and without IBD. Regulatory T cell subsets in the colon and ileum of these mice were analyzed by flow cytometry.
(A and B) The proportion of gut RORγt+ Treg cells varies in individual mice.
(C and D) The mean proportion of RORγt+ Treg cells the colon and ileum of groups of mice colonized with the same microbiotas. The data separated according to cohort shown in (D).
(E) The mean proportion of RORγt+ Treg cells the mLN of groups of mice colonized with the same microbiotas.
(F) Correlation between the proportion of RORγt+ Treg cells in different tissues in mice colonized with the same microbiotas.
(G) Co-expression of FoxP3 and IL-17A in CD4+ T cells. Each plot shows data from a different microbiota.
The numbers of RORγt+ Treg cells are presented as a proportion of live, CD45+, CD4+, FoxP3+ cells. Flow cytometry plots include data acquired at different times, thus gating differs between plots.
(A–F) n = 15healthy, 8 UC, and 7 CD microbiotas; (B) each point represents data from one mouse, in all other dot plots each point represents the mean value of a group of 2–12 mice colonized with a single microbiota. Data in (G) is representative of three mice colonized per microbiota. ns, not significant; *p < 0.05, **p < 0.01, ***p < 0.001, Student’s t est; solid horizontal lines indicate mean ± SEM, dashed horizontal lines represent the mean proportion of the cell type in germ free mice.
Regression p values calculated by f-test. See also Figure S2.