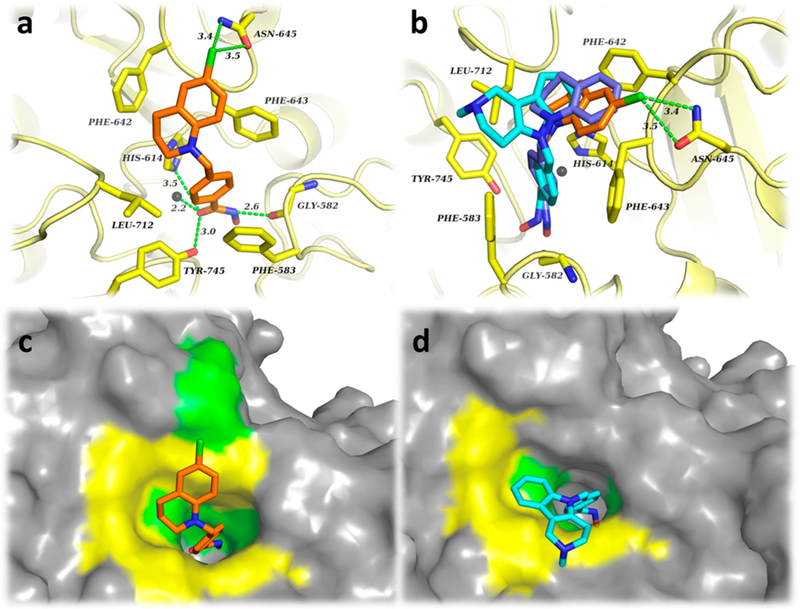
Figure 3.
(a) Binding interactions of SW-100 (orange) within the HDAC6-CD2. (b) Superimposed structures of SW-100 (orange), 16 (blue), and TubA (cyan) with HDAC6-CD2. (c) Surface pose of SW-100 (orange) within HDAC6-CD2. (d) Surface pose of TubA (cyan) within HDAC6-CD2. The Zn2+ ion is depicted as a gray sphere. Molecular surfaces are depicted in in gray, yellow (hydrophobic interaction area), and green (polar interaction area).

