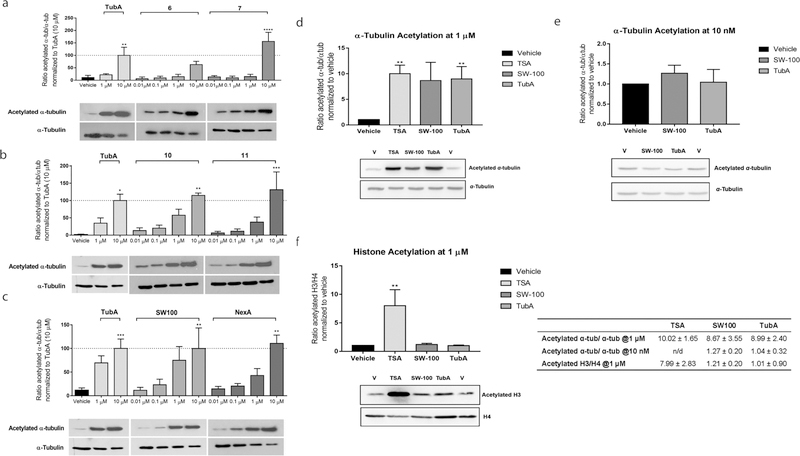
Figure 5.
SW-100 increases the levels of acetylated α-tubulin in a dose-dependent manner in HEK293 cells (a–c) and selectively increases the levels of acetylated α-tubulin in N2a cells (d–f). (a–c) The α-tubulin acetylation assay was carried out in HEK293 cells treated with the indicated drug and dose for a period of 48 h. Densitometric analysis of the acetyl-α-tubulin to total tubulin in these HEK293 cells was performed and the resulting ratios normalized to the 10 μM dose of TubA. Graphs are depicted as mean ± SEM of the resulting ratiometric values (test compounds: n = 3 or 4; TubA: n = 4; vehicle: n = 4). Statistical significance was analyzed by one-way ANOVA in comparison with the vehicle group. *p < 0.05, **p < 0.01, ***p < 0.001. (d–f) α-Tubulin/histone acetylation assays in N2a cells. N2a cells were treated with 1 μM or 10 nM SW-100. TubA and TSA were used as positive controls. The ratios of acetylated α-tubulin to total α-tubulin and acetylated histone 3 to histone 4 were quantified by Western blot. Tubulin acetylation and histone acetylation were repeated and normalized to the vehicle group. Graphs represent mean ± SEM n = 4. Statistical significance was analyzed by one-way ANOVA in comparison with the vehicle group. **p < 0.01. n/d, not determined.

