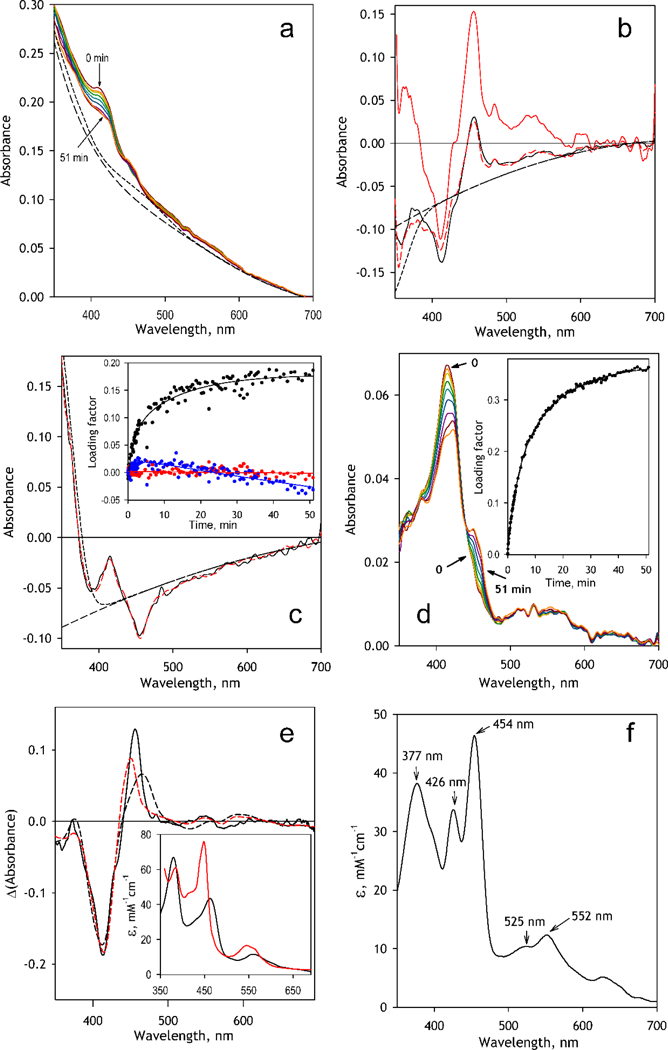
Fig. 4.

Analysis of the spectral changes observed in the process of incubation of CYP2D6-PLS with MDMA and NADPH. (a) a series of absorbance spectra recorded at 0, 0.3, 0.7, 1.5, 3, 6, 12.5, 25 and 51 min after addition of MDMA (64 μΜ). The dashed lines show the calculated contributions from turbidity alone (long dash) and in combination with absorbance of CPR (short dash); (b) Spectra of the first (black solid line) and the third (red or gray solid line) principal components. Dashed red (or gray) line shows the approximation of the 1st PC with the spectrum of the 3rd PC combined with the approximated contributions from turbidity (long dash) in combination with the changes in NADPH absorbance (short dash). (c) The spectrum of the 2nd PC (black solid line). Dashed red (or gray) line shows its approximation with the combination of the spectra of the 1st and the 3rd PC combined with the approximated contribution from turbidity (long dash) in combination with the changes in NADPH absorbance (short dash). The inset shows the changes in the loading factors for the 1st (black), 2nd (red or light gray) and 3rd (blue or dark gray) PC during incubation. (d) The same series of spectra after correction for the contributions from the turbidity, absorbance of CPR and changes in absorbance of NADPH. Inset shows the changes in the loading factor of the 1st PC; (e) The spectrum of the 1st PC for the series of corrected spectra (solid line) and its approximations with a combination of the CYP2D6 spectral standards and the prototypical spectra of absorbance of the bisthiolate complex of P450cam [59] (black dashed line) or the complex of P450cam(Fe2+) with CH3NO2 (red or gray dashed line). The respective prototypical spectra are shown in the inset. (f) The reconstructed spectrum of molar absorbtivity of the MDMA MIC of CYP2D6.
