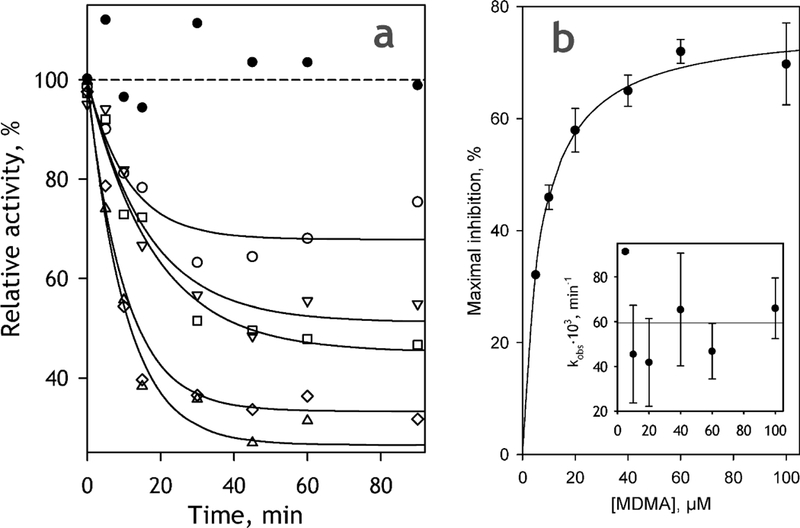
Fig. 6.

MDMA-dependent TDI of CYP2D6-PLS monitored with the use of DXM as a probe substrate. The curves shown on the panel (a) were obtained at 5 (empty circles), 10 (inverted triangles), 20 (squares), 60 (diamonds) and 100 μM (triangles). Solid line show the approximation of the datasets with a monoexponential equation. The change in the activity observed at no MDMA present are shown with filled circles. (b) Dependence of the maximal amplitude of TDI on the concentration of MDMA. The data points represent the mean values of the results of two experiments and the error bars show the respective standard deviations. Solid line shows the results of data fitting to the Michaelis-Menten equation. The inset shows the effect of MDMA concentration on kobs; horizontal solid line correspond to the averaged value of kobs.
