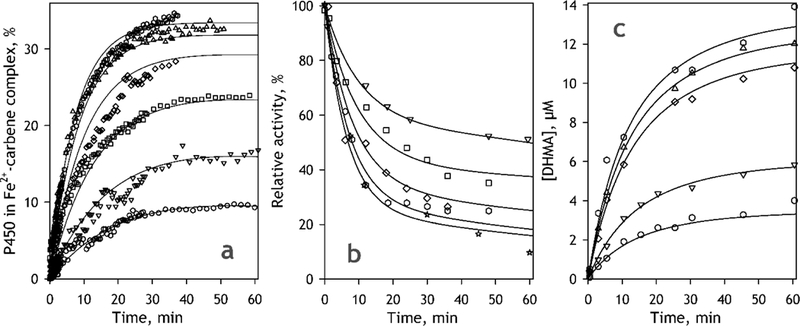
Fig. 9.

Results of fitting of the kinetics of MIC formation (a), TDI monitored by the rate of BMAMC metabolism (b) and the kinetics of DHMA formation (c) to a numerical solution of the system of differential equations corresponding to the model shown in Fig. 7. The data shown in the figures correspond to MDMA concentrations of 5 (open circles), 10 (inverted triangles) , 20 (squares), 40 (diamonds), 60 (triangles), 100 (hexagons) and 330 μΜ (stars). Solid lines represent the results of global fitting of each dataset.
