
Figure 5.
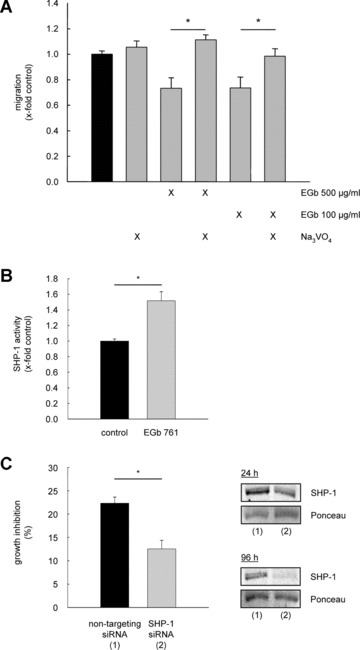
Induction of tyrosine phosphatase activity by EGb® 761 leads to the inhibitory effect on angiogenic parameters. (A) HUVEC monolayers were wounded and pre‐treated with Na3VO4 (10 mM, 30 min.) before stimulation with EGb® 761 for further 16 hrs. *P < 0.05 versus EGb® 761, with a concentration of 100 and 500 μg/ml, respectively. (B) HUVECs were either left untreated (co) or treated with EGb® 761 for 30 min. and subsequently washed and lysed. SHP‐1 activity was determined as described in Materials and Methods. *P < 0.05 versus control, Kruskal–Wallis one‐way ANOVA on ranks (Dunn's method). (C) HUVECs were either transfected with non‐targeting siRNA (1) or SHP‐1 siRNA (2). After 24 hrs, the cells were stimulated with EGb® 761 for 72 hrs. *P < 0.001 for SHP‐1 siRNA versus non‐targeting siRNA, Student's t‐test. The right panel shows reduced SHP‐1 protein levels in transfected cells after 24 and 96 hrs.