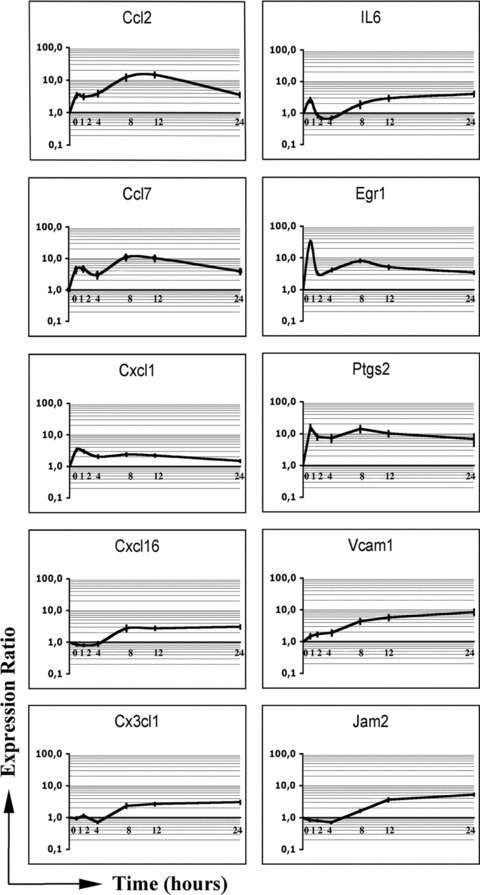
Figure 1.

qRT‐PCR time course analysis of selected inflammation‐related genes in FGF2‐stimulated endothelial cells. Serum starved 1G11 endothelial cells were stimulated with 30 ng/ml of FGF2 for 0, 1, 2, 4, 8, 12 and 24 hrs. Total RNA from each time‐point was reverse transcribed to cDNA and analysed by qRT‐PCR. Data (mean values ± SD, n= 3) represent the expression ratio of each target gene relative to the untreated control. Expression levels were normalized to β‐actin gene.
