
Figure 1.
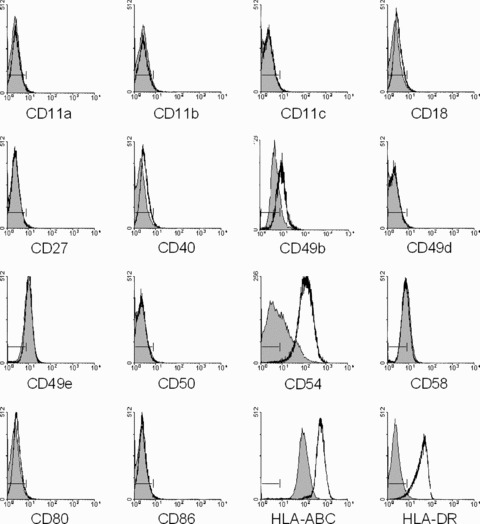
Immunophenotype of USSC. Expression of the molecules indicated on unstimulated (grey histograms) and stimulated USSC (1000 U/ml IFNγ; 6 days – open histograms) was analysed by flow cytometry. Staining with isotype controls is indicated (|––|).