
Figure 6.
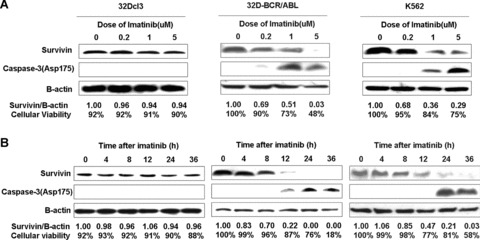
Decrease of survivin and introduction of cell death by imatinib treatment. Cells were treated for 24 hrs with imatinib in different concentrations (A) or with 2 uM imatinib for different time (B). Western blots show survivin expression and caspase‐3 activation upon imatinib treatment. The relative‐fold decrease of survivin protein after normalization to β‐actin internal control and the percentage of cell viability determined by trypan blue exclusion staining for each treatment are indicated.