
Figure 1.
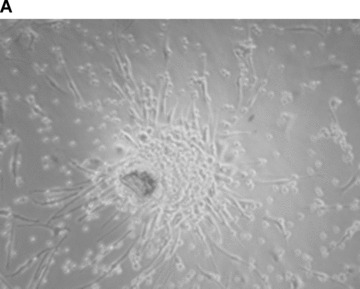
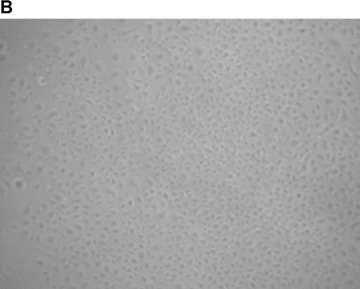


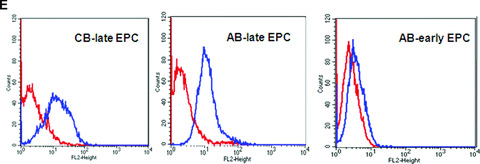
Characterization of early and late EPC. (A) Representative phase‐contrast photomicrograph of AB‐early EPC (mag. ×20). (B) Representative phase‐contrast photomicrograph of an AB‐late EPC colony (mag. ×20). (C) Growth curves of three types of EPC: early EPC isolated from adult blood (▪), and late EPC isolated from adult blood (–▴–) and cord blood (▾). (D) Ki‐67 differential expression between early EPC (left panel) and late EPC from adult blood (centre) and cord blood (right) by immunohistochemistry. Representative images of AB early EPC 10 days after plating and AB and CB late EPC before 40 days of culture after plating. (E) Expression of the thrombin receptor PAR‐1 in AB‐early, AB‐late and CB‐late EPC by flow cytometry. Representative histograms of detached EPC after immunolabelling with a control antibody (red line) and PAR‐1‐specific antibody (blue line).