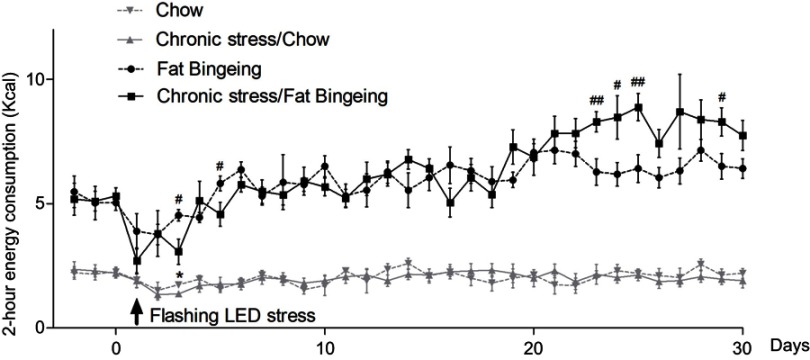
Figure 4.
Effect of chronic stress on daily food intake measured from 6:00 pm-8:00 pm in each group. * denotes significant differences in daily food intake between the chronic stress/chow group and chow group, and # denotes significant differences between the fat-bingeing group and chronic stress/fat-bingeing group (*P<0.05, #P<0.05, and ##P<0.01).

