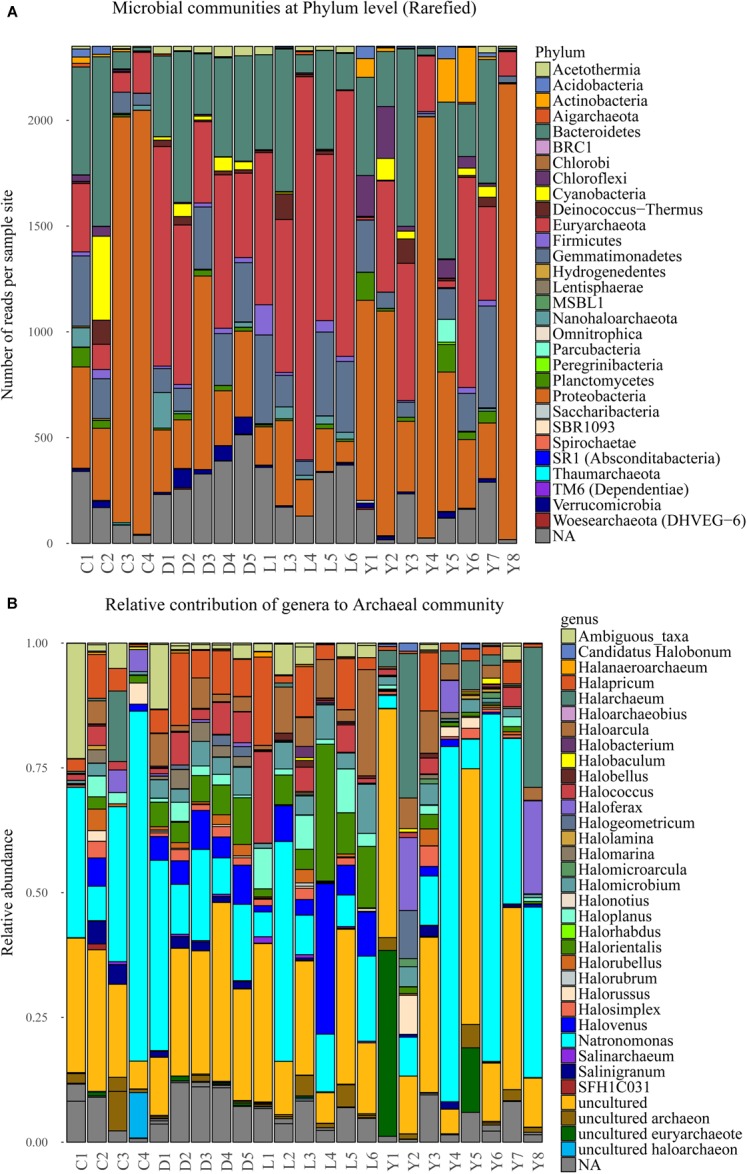
FIGURE 6.

(A) Stacked bar depicting the microbial composition at phylum level in the sediment samples of the rarefied dataset. (B) Normalized stacked bar plot of the archaeal community within the sediments shown at genus level. C, Lake Cowan; D, Lake Dundas; L, Lake Lefroy; Y, Lake Yellowdine.
