
Figure 6: Representative results for ion concentration calibration.
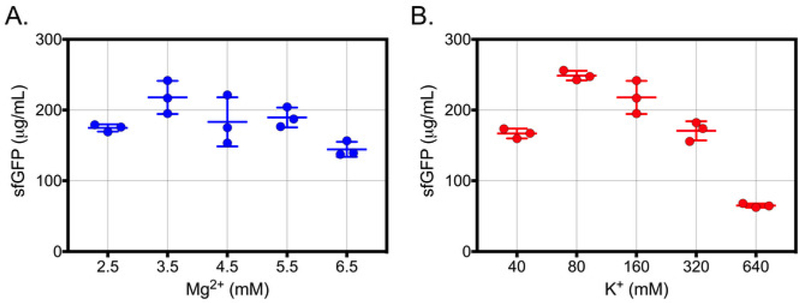
(A) V. natriegens cell-free reactions were supplemented with increasing concentrations of Mg2+ and incubated at 26 °C for 180 minutes in 10 μL reactions. The total concentration of K+ was 160 mM for all Mg2+ concentrations. Cell-free sfGFP concentration was determined using a standard curve of purified sfGFP measured at Ex/Em = 485 nm/528 nm. (B) V. natriegens cell-free reactions were supplemented with increasing concentrations of K+ and incubated at 26 °C for 180 min in 10 μL reactions. The total concentration of Mg2+ was 3.5 mM for all K+ concentrations. For both calibrations, samples were blank corrected using cell- free reactions supplemented with all components except template. The mean and standard deviations are shown (n = 3). This figure has been modified from Wiegand et al.9. Reprinted with permission from Wiegand, D.J., Lee, H.H., Ostrov, N., Church, G.M. Establishing a Cell-Free Vibrio natriegens Expression System. ACS Synthetic Biology. 7 (10), 2475–2479 (2018). Copyright 2018 American Chemical Society.