
Figure 3.
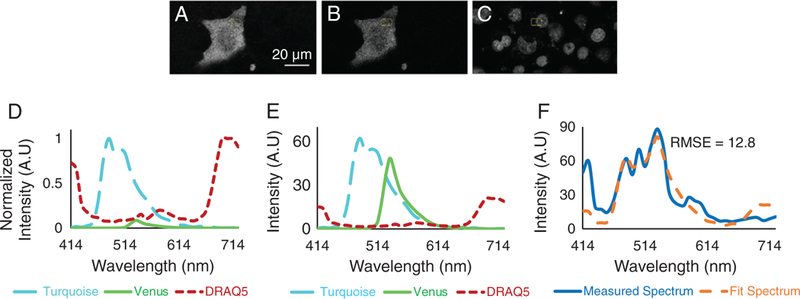
Unmixed Turquoise (A), Venus (B), and DRAQ5 (C) images obtained by non-negatively constrained linear unmixing of raw spectral image data with a three-component library (D). Note that the DRAQ5 unmixed image was linearly scaled to an 8-bit range for visualization purposes only. A region of interest was selected, and average abundances of each endmember were measured. The estimated contributions of each endmember were plotted (E), and the sum of endmember contributions was compared to the measured spectrum (F). The root-mean square error (RMSE) was calculated between the sum of endmember contributions and the measured spectrum (RMSE = 12.8 AU). [Color figure can be viewed at wileyonlinelibrary.com]