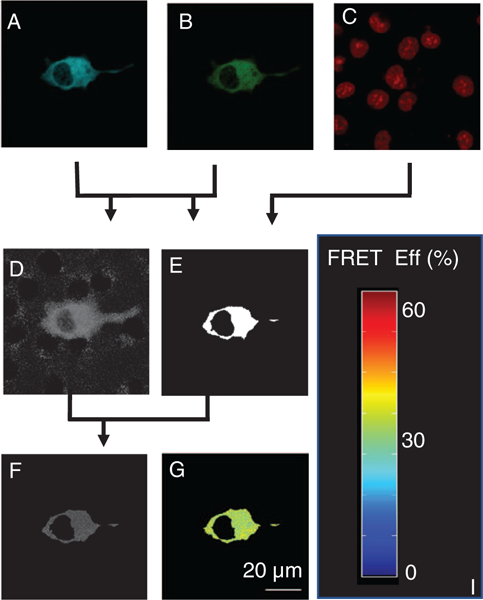
Figure 7.

Outline of the process for FRET calculation. Turquoise (A) and Venus (B) images were used to calculate FRET (D), and the sum of Turquoise + Venus images used to calculate the mask (E); DRAQ5 (C) was used to visualize and subsequently mask nuclear regions. (E) The mask was used to exclude extracellular and nuclear regions from the FRET image. (F) The FRET efficiencies were then visualized using a custom colormap (G). [Color figure can be viewed at wileyonlinelibrary.com]
