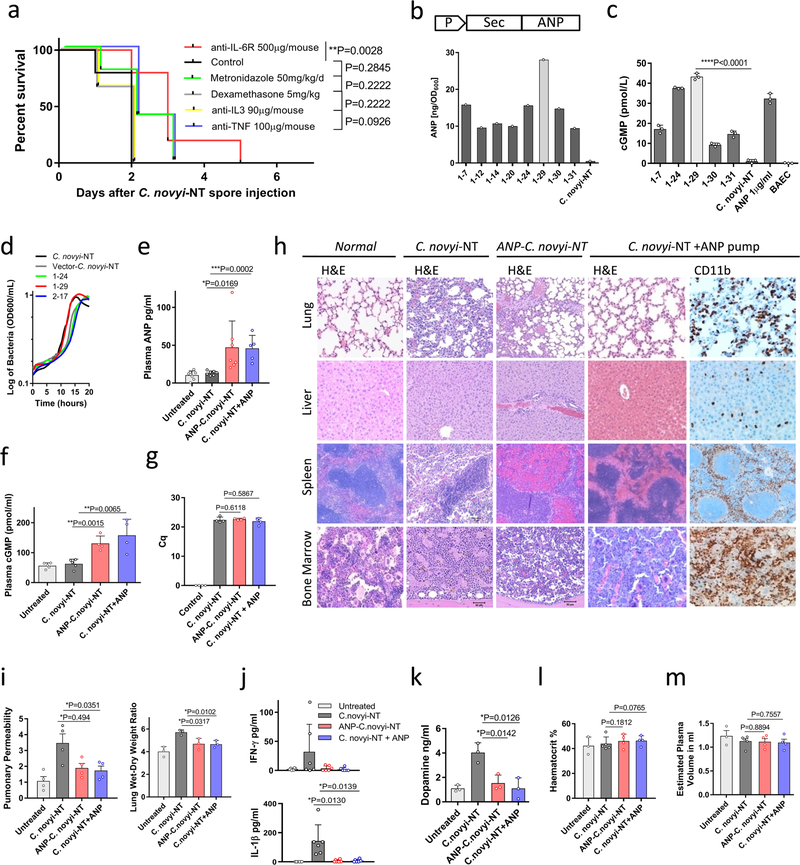
Extended Data Fig. 1 |. In vitro and in vivo studies of ANP-C. novyi-NT.
a, Kaplan–Meier curves of mice with large subcutaneous CT26 tumours (600–900 mm3), treated with 12 × 106 C. novyi-NT spores and the indicated agents: anti-IL-6R (n = 10), metronidazole (n = 5), dexamethasone (n = 6), anti-IL3 (n = 6) and anti-TNF (n = 5) injected intratumourally, compared to controls (n = 5). Survival differences were analysed by two-sided log-rank test. b and c, Selected clones of ANP-C. novyi-NT were analysed for ANP secretion, shown as the average of a triplicate, (b) and for cGMP induction (n = 3) using bovine aortic endothelial cells (c). d, Growth pattern of several clones compared to the parental C. novyi-NT. The average of a triplicate is shown. e–g, Levels of plasma ANP (left to right, n = 7, 8, 7, 5 independent samples per column) (e), plasma cGMP (n = 5, 5, 4, 4 samples per column) (f) and germinated C. novyi strains in tumour tissue (n = 4 samples per column) based on quantification cycle (Cq) from RT–PCR of germination-specific NT01CX1854 gene (g), measured at 36 h after spore injection. h, Representative haematoxylin and eosin as well as anti-CD11b antibody stained sections from the lungs, liver, spleen and bone marrow of mice treated with ANP-C. novyi-NT (n = 3), C. novyi-NT (n = 3) and C. novyi-NT plus ANP (n = 2) compared to normal controls (n = 2). i–m, Pulmonary permeability (n = 4 mice per group), lung wet–dry ratio (n = 3 mice per group) (i) as well as levels of cytokines (n = 6 independent samples per column) (j), dopamine (n = 3 independent samples per column) (k), haematocrit (n = 3, 5, 4, 4 samples per column) (l) and calculated plasma volume (n = 3, 5, 4, 4 samples per column) (m) measured 36 h after spore treatment. Data are presented as mean ± s.d. with individual data points shown, analysed by two-tailed t-test (c, e–g, i–m). BAEC, bovine aortic endothelial cells.

