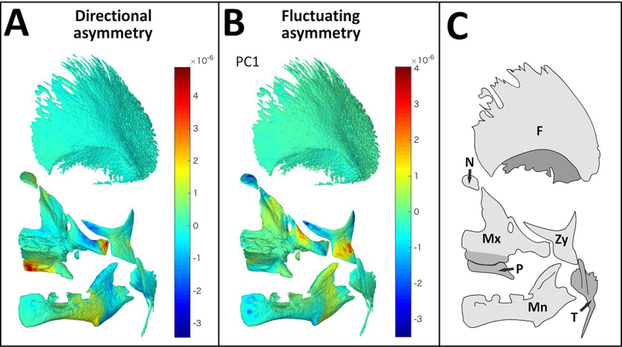
Fig. 2. GM analysis of asymmetry.
Mean surface mesh of facial bones (tilted frontal view) with color maps indicating areas of asymmetry assessed by GM. (A) Visualization of DA components, positive values (warm colors) represent areas that are larger on the left, while negative values (cold colors) represent areas which are large on the right side of the cranioskeleton. (B) Visualization of FA components (PC1). Values close to zero (green) represents symmetric areas while positive and negative values (warm and cold colors, respectively) represent asymmetric areas, as compared to mean shape along PC1. (C) Schema with key of facial bones: Mx=maxilla, Mn= mandible, P=palatal, Zy=zygoma, T= temporal, N=nasal, F=frontal)

