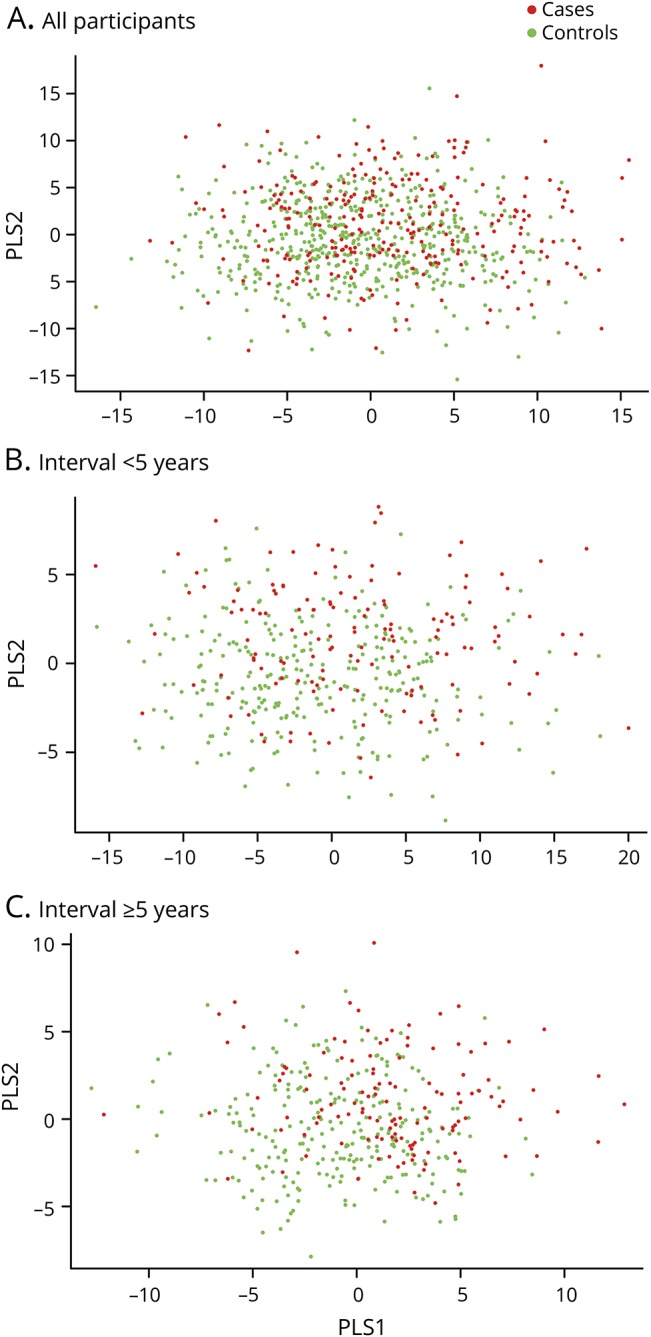
Figure 3. Partial least square (PLS) discrimination analysis plots.

(A) Including all participants. p Value from the permutation test: 0.1. (B) Restricted to participants with blood samples collected within 5 years of onset. p Value from the permutation test: 0.766. (C) Restricted to participants with blood samples collected 5 years or longer before disease onset. p Value from the permutation test: 0.075.
