Figure 1.

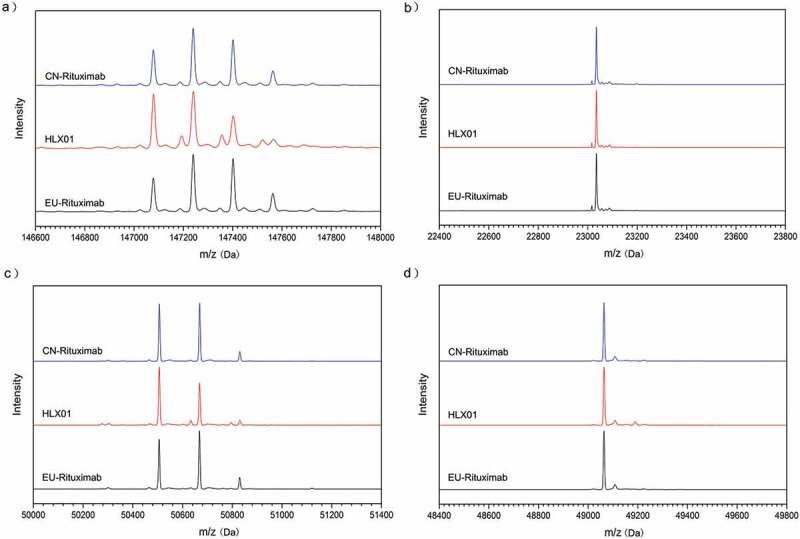
Comparison of protein masses of HLX01 and RPs. The MS spectra for intact mAb (a), reduced LC (b), reduced HC (c) and reduced and deglycosylated HC (d) of HLX01, CN-rituximab and EU-rituximab.

Comparison of protein masses of HLX01 and RPs. The MS spectra for intact mAb (a), reduced LC (b), reduced HC (c) and reduced and deglycosylated HC (d) of HLX01, CN-rituximab and EU-rituximab.