
Figure 7.
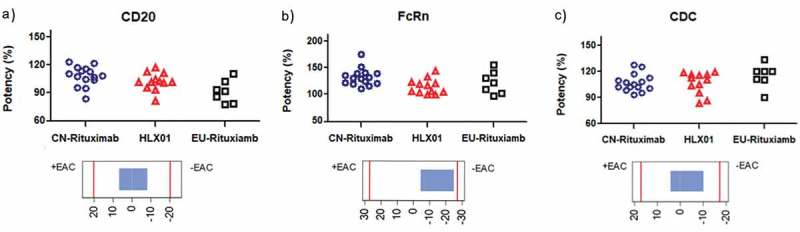
Comparison of Tier 1 biological quality attributes of HLX01, CN-rituximab and EU-rituximab. The dot plots of (a) CD20 binding affinity, (b) FcRn binding affinity and (c) CDC activity were plotted above corresponding equivalence test results showing 90% CI. Each marker shows the activity value of a specific batch: the blue dots show the values of CN-rituximab, red triangles show the values of HLX01, and black squares show the values of EU-rituximab.