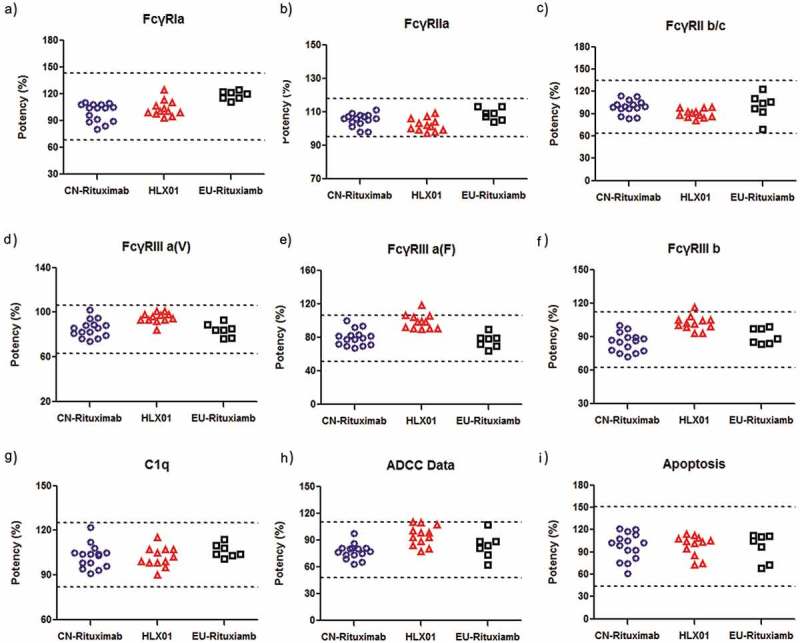
Figure 8.

Comparison of Tier 2 Fab and Fc related binding functions of HLX01, CN-rituximab and EU-rituximab. The dot plots of (a) FcγRIa binding affinity, (b) FcγRIIa binding affinity, (c) FcγRIIb/c binding affinity, (d) FcγRIIIa-F binding affinity, (e) FcγRIIIa-V biding affinity, (f) FcγRIIIb binding affinity, (g) C1q binding affinity, (h) ADCC activity, (i) Apoptosis activity. Each marker shows the activity value of a specific batch: the blue dots show the values of CN-rituximab, red triangles show the values of HLX01, and black squares show the values of EU-rituximab. Dashed lines represent quality range according to the suggestion of FDA (mean ± 3 SD).
