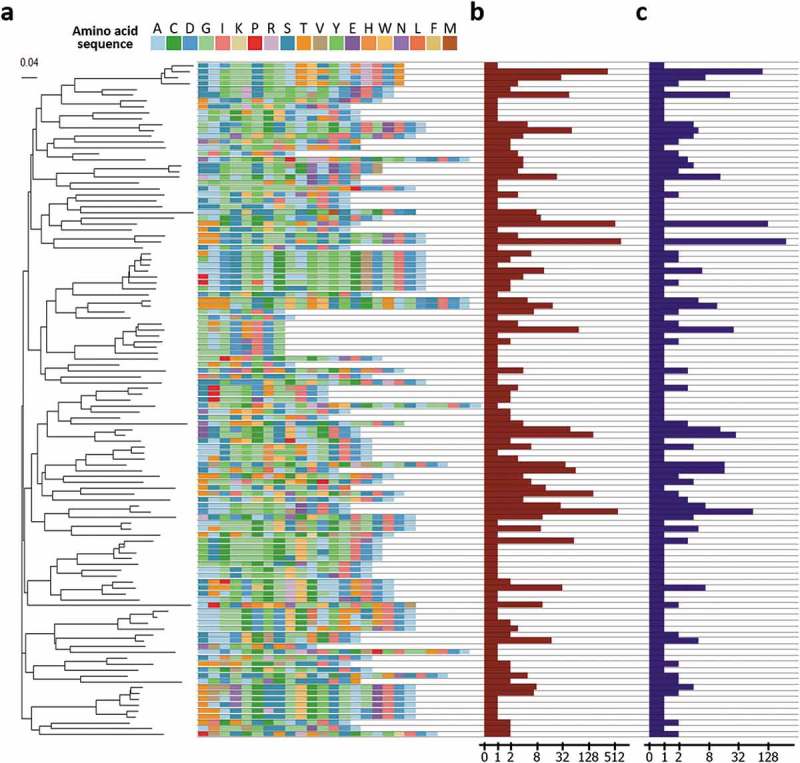
Figure 5.

Analysis of HCDR3 region of the clones. (a) HCDR3 clusters of the clones and a phylogenetic tree of the clusters. To interrogate diversity at the functional level, the clones were clustered based on the sequences of the HCDR3 region. A total 115 unique clusters were identified and confirmed to have a diverse composition of amino acid sequences of the HCDR3 region and a heterogeneous length of the HCDR3 region. Then, the tree was built by ClustalW2 using the neighbor joining method. The scale bar indicates the probability of substitution. (b) Clonal frequencies of the clusters. Clonal frequencies of the cluster represent the sum of clonal frequencies of the clones having the HCDR3 sequence of the clusters. The clonal frequency can be interpreted as the importance of a cluster with respect to binding activity. In the following genotype-based screening step, this value can be used. (c) The number of unique clones in the cluster. This value represents the number of unique clones having the HCDR3 sequence of the cluster. Based on this value, the number of different clones with a specific HCDR3 sequence can be captured. The clones can be screened based on the genotype of the clones.
