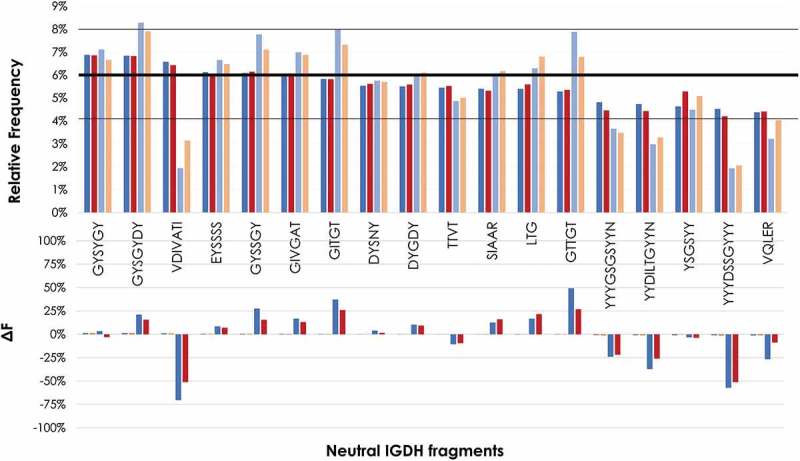
Figure 5.

Frequency of eighteen neutral IGHD fragments before and after filtration as determined by NGS. Top panel: Frequency of PLs and FLs. The first two bars per IGHD correspond to the PLs (PL1: blue; PL2: dark red). The other two bars per IGHD correspond to the FLs (FL1: light blue; PL2: orange). A horizontal bold line at 6% represents the expected frequency of an even distribution of the 18 IGHD fragments. Two black lines at 4% and 8% represents the range of the frequency variation in the PLs. Bottom panel: Difference in frequency (ΔF) of FLs with respect to PLs. ΔF was calculated as: IGHD frequency of the FL minus IGHD frequency of PL and normalized by IGHD frequency of PL x 100; that is: [(IGHD of FL – IGHD of PL)/IGHD of PL] x100.
