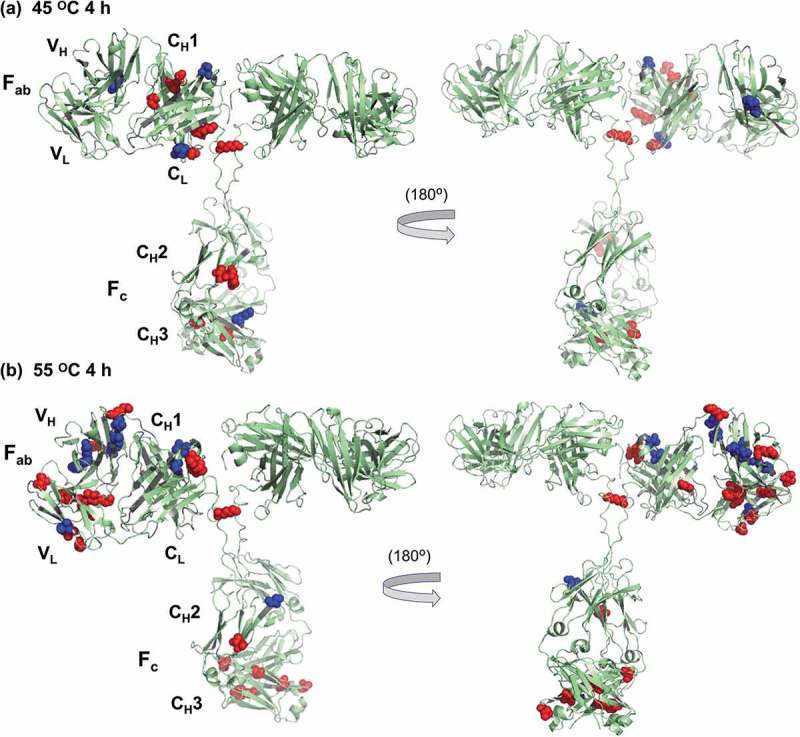
Figure 3.

Sites on rituximab that undergo significant labeling changes after heat stress at (a) 45°C for 4 h and (b) 55°C for 4 h, as compared to non-stressed rituximab. Spheres represent residues that undergo significant changes in label levels (p < 0.05). Red represents labeling increases while blue represents decreases. Note that, for clarity, only one asymmetric unit of rituximab structure is labeled in this figure. As no full-length structures of rituximab are available in a protein data bank (PDB), we used existing Fab and Fc crystal structures of rituximab to generate a molecular model for the entire rituximab molecule. A full-length human IgG1 model, from which atomic coordinates were generated using PDBs 2IG2 (Fc) and 1FC2 (Fab) with a hinge region and other details theoretically modeled57,58, was used as a template. Fc (PDB 4W4N) and Fab (PDB 4KAQ) structures of rituximab were then aligned to the template, using the molecular visualization system PyMOL.
