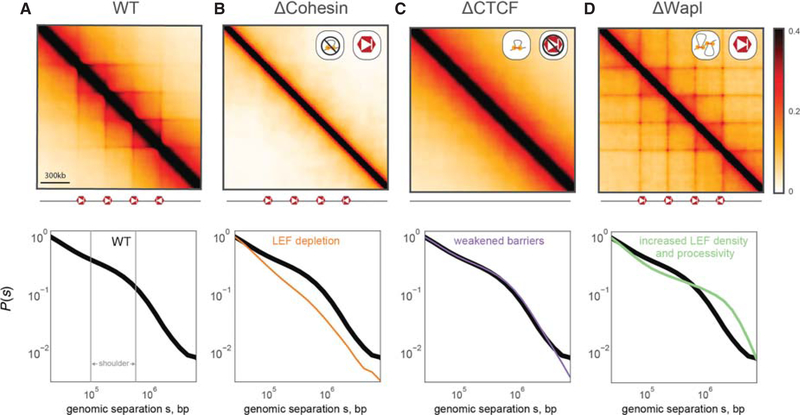
Figure 2.
Loop extrusion polymer simulations predict the consequences of cohesin and CTCF perturbations. (Top row) Simulated Hi-C maps for indicated perturbations. (Bottom row) P(s) for indicated perturbation compared to WT P(s). All simulations considered a 36-Mb chain (3600 monomers) with the same positions and orientations of CTCF barriers (separated by 300 kb) and the same LEF velocity (250 3D-per-1D steps). (A) WT simulations used processivity 200 kb, separation 200 kb, and barrier strength 0.995. The shoulder in P(s), indicative of compaction via loop extrusion, is indicated in gray. (B) For ΔCohesin, our simulations predict the loss of TADs, peaks, flames, and the shoulder of P(s). ΔCohesin was simulated using processivity 200 kb, separation 2 Mb, and boundary strength 0.995. This can represent the loss of actively extruding cohesins via ΔNipbl, ΔRad21, or other cohesin subunits. (C) For ΔCTCF, our simulations predict the loss of TADs, peaks, flames, yet no discernible change to P(s). This arises because CTCF plays an instructive role for the activity of extrusion. ΔCTCF was simulated using processivity 200 kb, separation 200 kb, and boundary strength 0.9. (D) For ΔWapl, our simulations predict the emergence of additional peaks, including at further genomic separations, as well as an extension of the shoulder in P(s). ΔWapl was simulated using processivity 1 Mb, separation 150 kb, and boundary strength 0.995.

