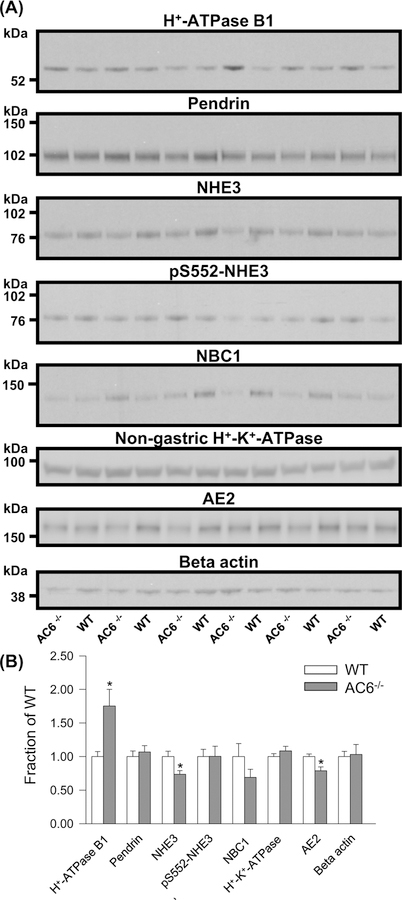
Figure 2. AC6−/− mice present higher H+-ATPase B1 subunit abundance during standard condition.
(A) Semiquantitative immunoblotting of 17000 g membrane fraction of whole kidney lysates from WT and AC6−/− mice (baseline conditions) using antibodies targetting various proteins involved in acid–base regulation. (B) Summary data demonstrate higher abundance of the H+-ATPase B1 subunit and lower abundances of NHE3 and AE2. Values indicate mean ± S.E.M.; n=6/genotype, *P<0.05.

