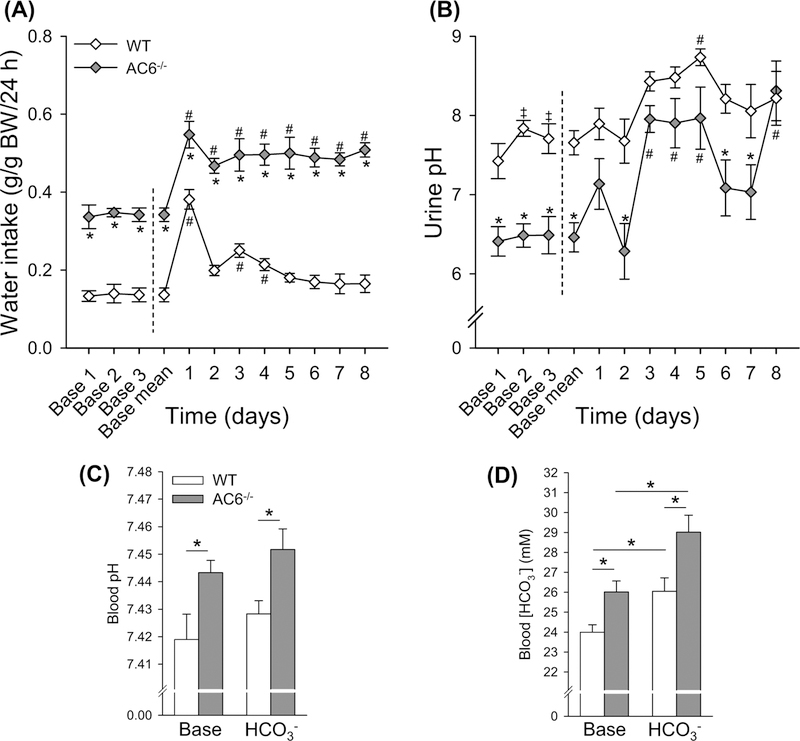
Figure 3. AC6−/− mice present higher blood pH and blood HCO3− under baseline conditions and after 8 days of HCO3− challenge.
To test for a defect in HCO3− handling, AC6−/−mice and WT mice were followed for 3 days during baseline conditions and subsequently challenged with HCO3− (NaHCO3) loading for 8 days (supplied via drinking water). Because daily water intake is double in AC6−/− mice, NaHCO3 was supplied to this genotype at a 50% lower concentration compared with WT mice (0.14 in AC6−/− mice compared with 0.28 M in WT mice). (A) Water intake during baseline conditions and during HCO3− loading (n=3 per genotype; one data point is the average of two mice kept in the same cage). (B) Urinary pH during baseline conditions and during HCO3− challenge (n=6/genotype). (C,D) Blood pH and HCO3− concentrations under baseline conditions and after 8 days HCO3− challenge (n=6/genotype). Statistical comparisons in (A,B): *AC6−/− compared with WT mice (P<0.05); left side of dashed line, ‡baseline day 1 compared with baseline day 2 or 3 in WT mice (P<0.05); right side of dashed line, #baseline mean compared with HCO3− challenge in both genotypes (P<0.05). Statistical comparisons in (C,D): *compared with WT mice or baseline (P<0.05). Statistical comparisons on left and right side of dashed line in (A,B) were performed separately using two-way repeated measurement ANOVAs. Values indicate mean ± S.E.M. Values on bars indicate sample size. Abbreviation: Base, Baseline.

