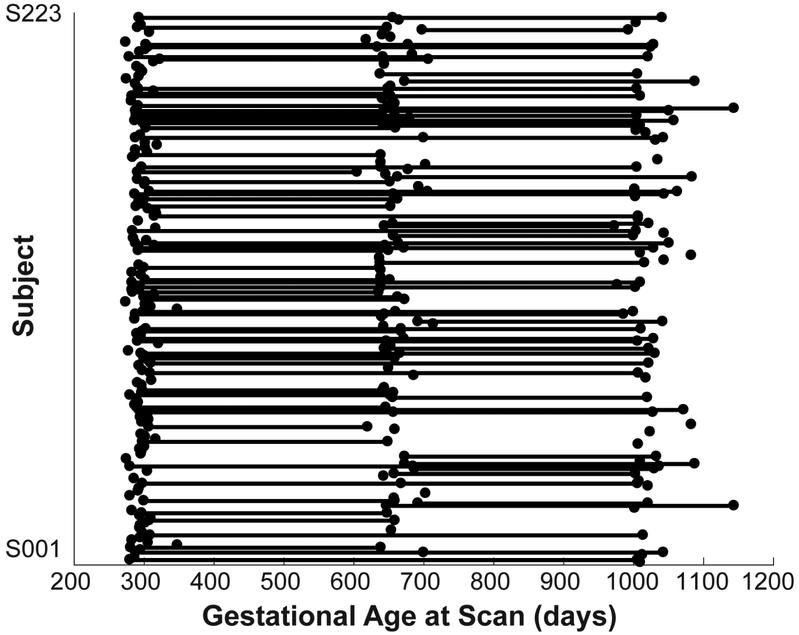
Figure 1: Data distribution.
The distribution of gestational age at scan for all included infant subjects (N = 223 totaling 334 datasets; neonate (NEO), 1-year (1YR), and 2-year (2YR) old) whose image quality passed the quality control procedures. Each dot represents a successful rsfMRI scan and dots along each line represent all the available longitudinal scans for a given subject; NEO: N = 152, 1YR: N = 105, 2YR: N = 77, NEO & 1YR: N = 57, 1YR & 2YR: N = 44, NEO & 2YR: N = 10, and NEO & 1YR & 2YR: N = 25.

