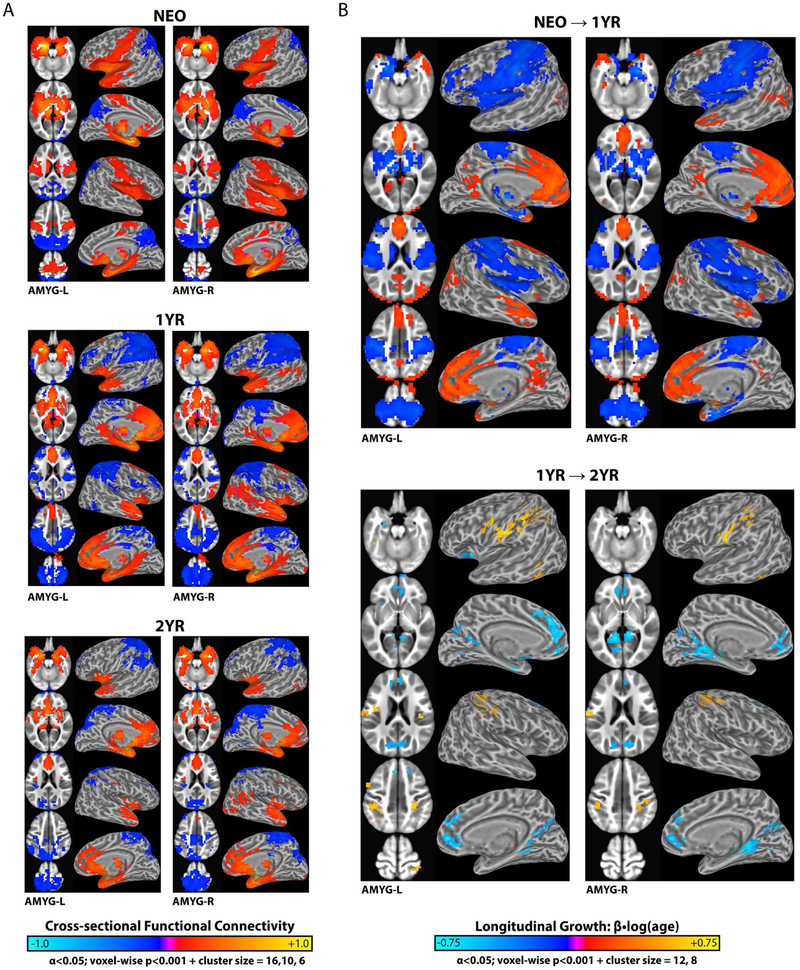
Figure 2: Regional functional connectivity (FC) and corresponding longitudinal changes for the left and right amygdala (AMYG-L/R) in neonates (NEO), 1-year (1YR), and 2-year old (2YR).
(a) Cross-sectional patterns of significant positive (warm colors) and negative (cool colors) amygdala FC. (b) Patterns of significant positive and negative amygdala FC growth: NEO→1YR and 1YR→2YR. Growth or age-dependent changes [β•log(age)] characterized using linear-mixed effect modeling (random intercept + slope) controlling for other participant characteristics (i.e. sex, twin status, motion, maternal education, and birth weight). See Tables S3-6 for full breakdown of significant clusters.

