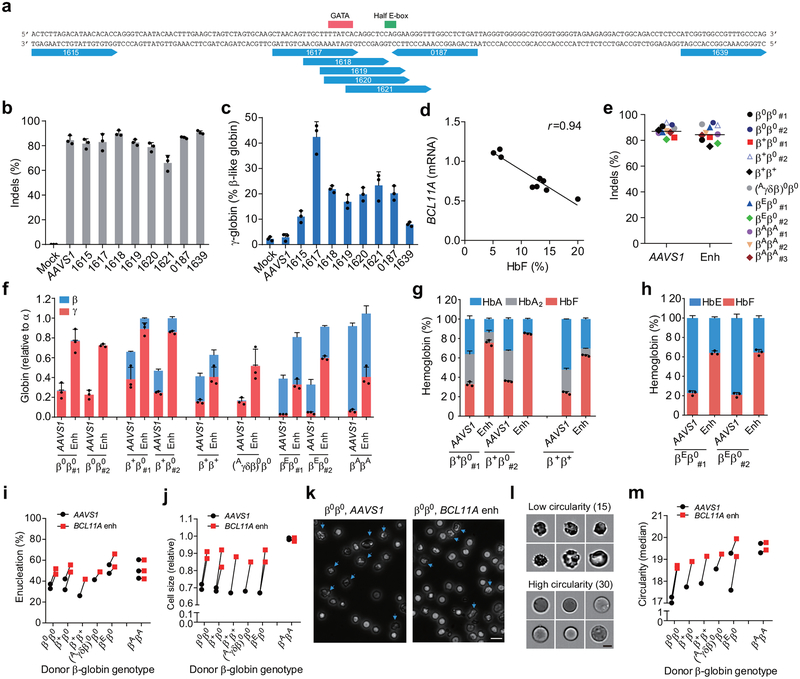
Figure 1 |. Identification of efficient BCL11A enhancer guide RNAs for HbF induction and amelioration of β-thalassemia.
a, Eight modified synthetic (MS) sgRNAs targeting BCL11A enhancer DHS h+58 functional core marked with blue arrows. GATA and Half E-box motifs marked respectively with red or green. b, Editing efficiency of Cas9 coupled with various sgRNAs (each targeting BCL11A enhancer with exception of AAVS1) in CD34+ HSPCs measured by TIDE analysis. c, β-like globin expression by RT-qPCR analysis in erythroid cells in vitro differentiated from RNP edited CD34+ HSPCs. d, Correlation of BCL11A mRNA expression determined by RT-qPCR versus HbF by HPLC. Black dots represent samples edited with Cas9 coupled with different sgRNAs. The Pearson correlation coefficient (r) is shown. e, Editing efficiency as measured by TIDE analysis of Cas9:sgRNA RNP targeting AAVS1 or BCL11A DHS h+58 functional core (Enh) with MS-sgRNA-1617 in CD34+ HSPCs from β-thalassemia patients or healthy donors (βAβA) of indicated β-globin genotypes. f-h, β-like globin expression by RT-qPCR normalized by α-globin (P = 0.00017 for BCL11A enhancer as compared to AAVS1 edited for all comparisons as determined by unpaired two-tailed Student’s t tests), and HbF induction by HPLC analysis in erythroid cells in vitro differentiated. i, Enucleation of in vitro differentiated erythroid cells. j, Cell size measured by relative forward scatter intensity. k, Representative microscopy image showing rounder and more uniform appearance of enucleated erythroid cells following BCL11A enhancer editing. Blue arrow indicates poikilocytes. Bar = 15 μm. l, m, Imaging flow cytometry was used to establish a circularity index (l) and then quantify (m) circularity of enucleated erythroid cells. Bar = 5 μm. In all panels, data are plotted as mean ± SD and analyzed using unpaired two-tailed Student’s t tests. Data are representative of three biologically independent replicates.

