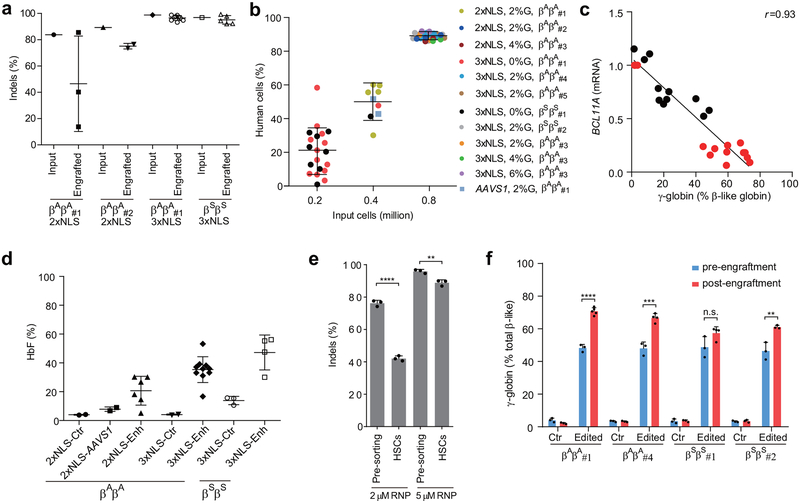
Extended Data Figure 8 |. Summary of engraftment analysis.
a, Indel frequencies of indicated input HSPCs and engrafted human cells in 16 week BM. b. Correlation between input cell number and human engraftment rates in 16 week BM. c, Correlation of BCL11A mRNA versus γ-globin mRNA determined by RT-qPCR. Black dots represent erythroid cells from CD34+ HSPCs edited with SpCas9 coupled with various sgRNAs differentiated in vitro without engraftment; red dots represent erythroid cells sorted from mice BM engrafted from human CD34+ HSPCs edited with SpCas9 coupled with MS-sgRNA-1617. The Pearson correlation coefficient (r) is shown. d, BM cells (engrafted from donor βAβA#1 and βSβS#1) collected from engrafted mice were in vitro differentiated to human erythroid cells for HbF level analysis by HPLC. Each dot represents erythroid cells differentiated from BM of one mouse, and mean ± SD for each group is shown. e, Relative loss of indels in HSC-enriched CD34+ CD38- CD90+ CD45RA- sorted population as compared to bulk pre-sorted HSPCs after editing by 2 μM or 5 μM RNP. All data represent the mean ±SD. Statistically significant differences are indicated as follows: ****P < 0.0001, **P < 0.01 (P=0.0046) as determined by unpaired t test. f. Comparison of β-like globin expression by RT-qPCR between erythroid cells in vitro differentiated from RNP edited CD34+ HSPCs (pre-engraftment) and engrafted bone marrow (post-engraftment). Statistically significant differences are indicated as follows: ****P < 0.0001, ***P < 0.001 (P=0.0006), **P < 0.01 (P=0.0092) as determined by unpaired t test. In all panels, data are plotted as mean ± SD and analyzed using unpaired two-tailed Student’s t tests. Data are from indicated number of mice for (a, b, d) or representative of three biologically independent replicates for (c, e, f).

