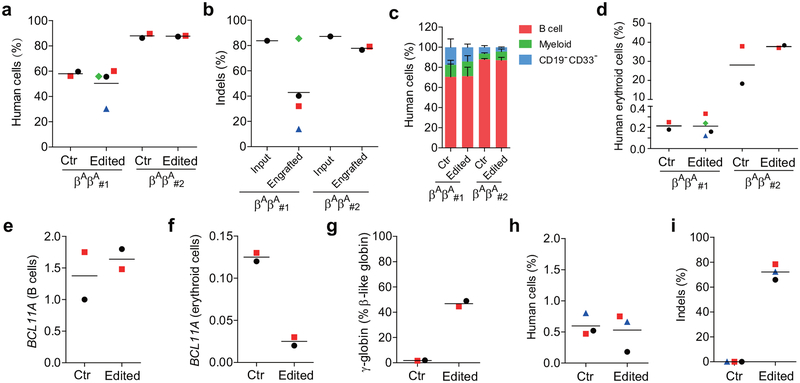
Extended Data Figure 3 |. Long-term multi-lineage engraftment of BCL11A enhancer edited HSPCs in immunodeficient mice.
CD34+ HSPCs from two healthy donors were electroporated with 2xNLS-SpCas9 RNP (coupled with MS-sgRNA-1617) and transplanted into NBSGW mice. Non-electroporated cells were transplanted as controls. 0.4 million cells per mouse were infused for donor βAβA#1, and 0.8 million cells per mouse for donor βAβA#2. a, Mouse bone marrow (BM) was analyzed for human cell chimerism by flow cytometry 16 weeks after transplantation, defined as %hCD45+/(%hCD45++%mCD45+) cells. Each symbol represents a mouse, and mean for each group is shown. b, Indels at the human BCL11A enhancer were determined by TIDE analysis in the input HSPCs prior to transplant and in the mouse bone marrow 16 weeks after transplant. Each engrafted dot represents one mouse, and mean for each group is shown. c, BM collected 16 weeks after transplantation was analyzed by flow cytometry for multilineage reconstitution (calculated as percentage of hCD45+ cells). d, BM collected 16 weeks after transplantation was analyzed by flow cytometry for CD235a+ erythroid cells (calculated as percentage of mCD45−hCD45− cells). e-g, Gene expression analysis by RT-qPCR in human cells (from donor βAβA#2) from BM of engrafted mice. BCL11A expression normalized by CAT in human B cells (e) or human erythroid cells (f) sorted from BM of engrafted mice, and β-like globin expression (g) by RT-qPCR in human erythroid cells sorted from BM. h, BM from one engrafted mouse with unedited control or edited cells (from donor βAβA#1) were transplanted to three secondary NBSGW mice each (control mouse shown with black circle and edited mouse with green diamond symbol in (a, b, d). After 16 weeks, BM was analyzed for human cell chimerism by flow cytometry. i, Indel frequencies within human BCL11A enhancer in BM 16 weeks after secondary transplantation. Each symbol represents an individual recipient mouse. Data are plotted as mean ± SD for (c). Median of each group with 2 to 4 mice is shown as line for the other panels.

