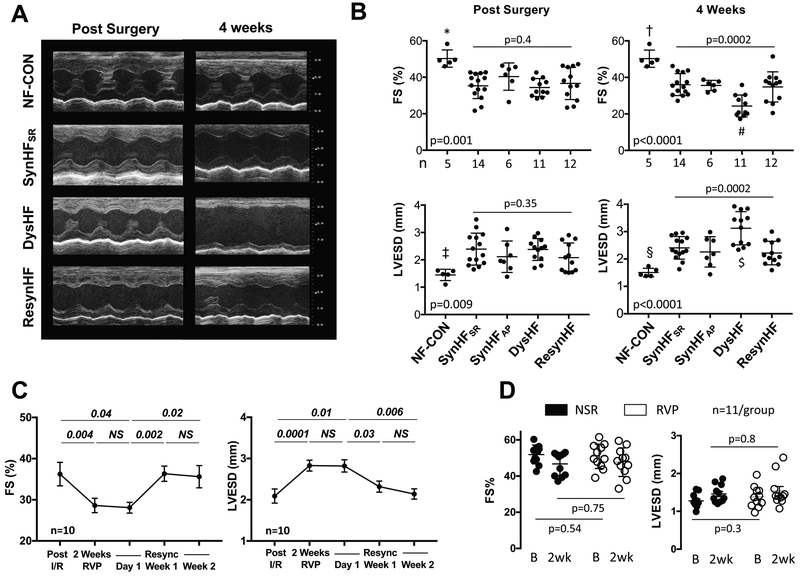
Figure 4. Effect of chronic dyssynchrony and resynchronization on LV function in mice following I/R injury.
(A), Example echocardiograms early post I/R and after 4-weeks pacing protocol in non-failing controls (NF-CON), synchronous HF (SynHFSR), dyssynchronous HF (DysHF), and resynchronized HF (ResynHF). (B), Summary scatter plots with mean±SD for percent fractional shortening (FS) and LV end-systolic dimension (LVESD) for the same two time points. P-values displayed are for 1-WANOVA; symbols are for pairwise comparisons by Tukey Test. *p=0.0007,†p=0.0004,‡p=0.003,§p=0.003 vs SynHFSR; *p=0.0005, †p=0.0001,‡p=0.004, §p=0.0001 vs DysHF; *p=0.0025,†p=0.0001,‡p=0.07,§p=0.0001 vs ResynHF; *p=0.08, †p=0.0015,‡p=0.09,§p=0.03 vs SynHFAP; # p<0.008; $ p<0.004 vs other pacing groups. (C), Time-plots (mean ± SEM) for full protocol for FS and LVESD in RsynHF mice (n=10). Data analyzed by repeated measures 1W-ANOVA, followed by Sidak’s multiple comparisons test (p-values shown). (D) FS and LVESD from NF-Lead and NF-RVP control groups at initial baseline (B) and after 2-weeks (2wk). Data analyzed by 1WANOVA, with Sidak’s multiple comparisons test. There was no significant change in either parameter with RVP in the otherwise normal ventricle.

