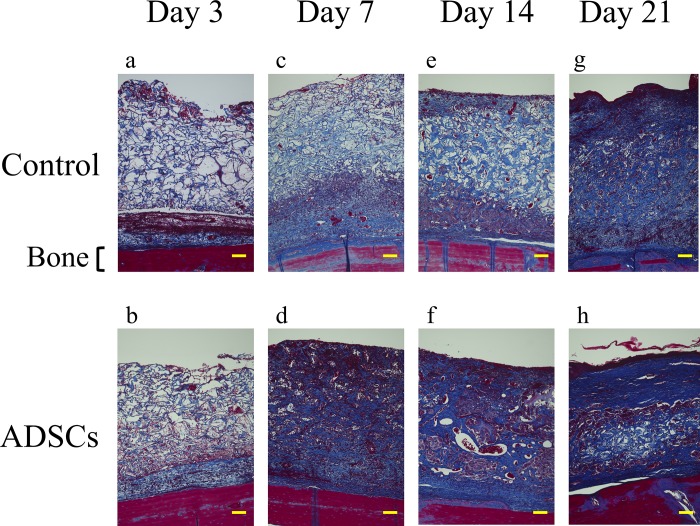
Fig 4. Representative magnified images (100x) of Masson's trichrome-stained histological sections of the center of the wound along with implantation time.
Histological sections at day 3, 7, 14, and 21 highlight the wound healing progression along the experimental time frame. Scale bars indicate 100 μm for all panels.

