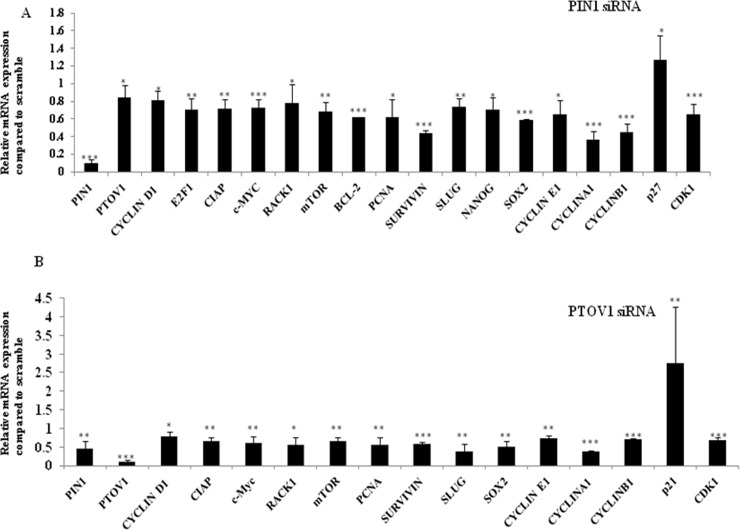
Fig 5. Silencing of PIN1 and PTOV1 share similar expression profile for the majority of genes at the transcriptional level.
(A) The upper panel represents the expression of mRNA after transfecting cells with PIN1 siRNA for 72 hours. (B) The lower panel represents the expression of mRNA after knockdown with PTOV1 siRNA for 72 hours. Relative expression was calculated using delta-delta CT method. The expression in scramble group was considered 1.00. Experiments were performed in triplicates. Data are represented as mean ± SD.*, **, *** represents significant difference from the scramble with p< 0.05, 0.01 and 0.001 respectively.

