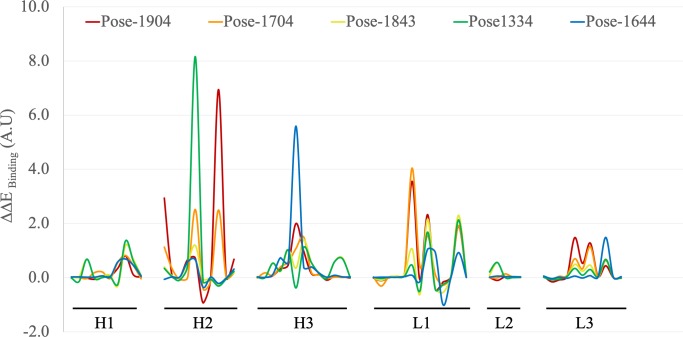
Fig 4. In silico alanine scanning mutagenesis was completed for all five poses.
Poses 1904, 1704, 1843, 1334 and 1644 are shown in red, orange, yellow, green and blue respectively. The graph shows relative ΔΔEbinding changes upon alanine mutation for the five candidate docked poses across the IMGT-defined CDR regions.

